Download
1 / 17
180 likes | 295 Views
ENVIRONMENT CANADA ENVIRONNEMENT CANADA. Verification of extreme events. Barbara Casati (Environment Canada) D.B. Stephenson (University of Reading). Extreme events can be defined by: Maxima/minima Magnitude Rarity Impact/losses. Gare Montparnasse, 22 October 1895.

E N D
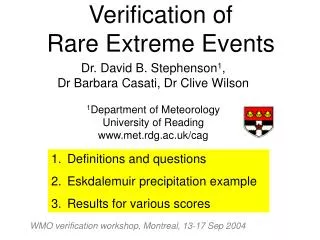
ENVIRONMENT CANADA ENVIRONNEMENT CANADA Verification of extreme events Barbara Casati (Environment Canada) D.B. Stephenson (University of Reading)
Extreme events can be defined by: Maxima/minima Magnitude Rarity Impact/losses Gare Montparnasse, 22 October 1895 What is an extreme event? Definition: intense/extreme/rare events are the events in the tail of the distribution “Man can believe the impossible, but man can never believe the improbable.” - Oscar Wilde
Q1: is there any skill in forecasting extremes ? Q2:Are traditional categorical verification scores able to detect skill for extreme events ? Q3: does hedging affect the extreme event verification scores ? Q4: Which scores are more suitable for verifying extremes ? Driving questions
X Binary Analysis Y Binary Forecast Overlapping Contingency Image and Table Threshold (u) Binary Images Contingency Table (joint distribution) Categorical Scores and Skill Scores: TS, ETS, HSS, KSS, OR, YQ, ROC curve.
A B C D E F G H NIMROD case studies
Categorical scores versus threshold As the threshold increases TS,ETS,HSS,KSS converge to zero (no skill) for all the cases As the threshold increasesodds’ ratio, ROC, Yule’s Q, separates the cases Why do the scores behave differently ?
Base rate versus threshold Base Rate = Probability of the event Threshold increases, base rate decreases Intense/extreme/rare events when 0
Categorical scores versus base rate Plots in logarithmic scale: the rate of convergence of the statistics plays a key role in discriminating the NIMROD cases
Behavior of the hits Asymptotic model: = slope parameter b > 1 for ROC curve regularity b = 2 for random forecast: • b > 2 no skill • b < 2 skill
Asymptotic behaviour of the joint distribution (un-biased forecast) 2 degrees of freedom: (, ) fully describe the joint distribution Express joint probabilities and verification statistics as functions of , Analyze statistics asymptotic behavior when the base rate 0
Scores asymptotic behaviour (no bias) TS, ETS,HSS, KSS magnitude converges to zero as 0 either for skilful, random or worse than random forecasts ( acts as adiminishing factor) Odds Ratio exhibits different asymptotic behaviours depending on whether a/n converge to zero faster, at the same rate or slower than a/n for a random forecast
Asymptotic behaviour of the joint distribution (biased forecast) 3 degrees of freedom: (B, , ) fully describe the joint distribution Express joint probabilities and verification statistics as functions of B, , Analyze statistics asymptotic behavior when the base rate 0 Analyze statistics sensitivity to the bias B in the limit 0
Scores asymptotic behaviour (bias) magnitude of TS, ETS, HSS, KSS monotonically increase as B increases: encourage over-forecasting !! The odds’ ratio is not affected by the bias
Extreme dependency score forecast and obs values are transformed into empirical cumulative probabilities uniform marginal distributions, no bias cumulative probability: p = 1 – base rate as 0, thenp 1 intense/extreme/rare events b’ a’ d’ c’
Extreme Dependency Score • does not depend on the base rate • is not affected by the BIAS • it depends only on the parameter (rate of convergence of the joint probability a/n to zero, as the events get rarer) • separate the case studies EDS measures forecast and obs extreme dependency
TS, ETS,HSS, KSS magnitude converges to zero either for skilful, random or worse than random forecasts: not suitable to verify extremes Odds ratio, Yule’s Q, ROC are more suitable for detecting the skill in forecasting extreme/rare events TS, ETS,HSS, KSS are overly sensitive to the bias in extreme event situations and encourage over-forecasting the odds ratio, Yule’s Q, ROC are not affected by the bias when verifying extreme/rare events The Extreme Dependency Score provides a bias and base rate independent measure of extreme dependency: very suitable to verify extremes Conclusions
References S. Coles, J. Heffernan, J. Tawn (1999) “Dependence Measures for Extreme Value Analyses”, Extremes 2:4, pp. 339-365 C. Ferro (2007) “A probability model for verifying deterministic forecasts of extreme events”, Weather & Forecasting, in press B. Casati (2004) “New approaches for the verification of spatial precipitation forecasts”, PhD Thesis (Chapter 6), available at http://www.met.rdg.ac.uk/~swr00bc/PhD.html D.B. Stephenson, B. Casati, C. Wilson (2004) “Skill measures for forecasts of rare extreme events”, presentation given at the 2nd international workshop on verification methods, Montreal, Sept 2004. THANK YOU !