Download
1 / 23
240 likes | 410 Views
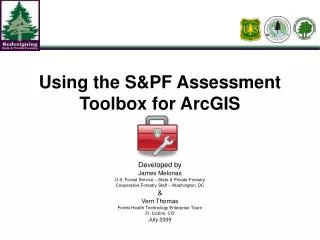
Using the S&PF Assessment Toolbox for ArcGIS. Developed by James Melonas U.S. Forest Service – State & Private Forestry Cooperative Forestry Staff – Washington, DC & Vern Thomas Forest Health Technology Enterprise Team Ft. Collins, CO July 2009. What’s the S&PF Assessment Toolbox?.

E N D
Using the S&PF Assessment Toolbox for ArcGIS Developed by James Melonas U.S. Forest Service – State & Private Forestry Cooperative Forestry Staff – Washington, DC & Vern Thomas Forest Health Technology Enterprise Team Ft. Collins, CO July 2009
What’s the S&PF Assessment Toolbox? • Reclassify layers to a standard 0 to 10 scale for comparison • A set of tools in ArcGIS that walk you through an assessment process to identify priority areas. • The tools are simple and flexible – 4 steps: • Weight your data layers • Overlay your data layers • Aggregate to a management unit
Overview • This presentation will show you how to use the S&PF Assessment Toolbox. • Topics: • Before you Begin… • Set-Up • Reclassify • Weighted Overlay • Aggregate • Questions and Support
Before you Begin… • Identify your objectives and strategic questions • Assemble Data Layers to answer those questions • Rank and Weight Layers and Themes…
Before you Begin: Ranking & Weighting • This should be a collaborative process with stakeholder and expert involvement • This Excel worksheet can help you assign weights based on relative values Weighting Worksheet
Before you Begin: Ranking & Weighting • How to use the Worksheet: • Rank each criterion based on its importance. • Starting with the most important criterion – give it a rank of “most important”. Compare others relative to that. • More than 1 criterion can be “most important” • If using themes – rank weights within each theme, then rank relative value of themes. Focus on words rather than numbers…the worksheet will process the numbers you will use in the weighted overlay section.
Set-Up • Open ArcToolbox in ArcMap • Right Click on ArcToolbox and then “Add toolbox…” • Browse to where you saved the toolbox and then click “Open”. The toolbox will be added to your view.
Set-Up • Make sure the PythonWin32 extension is installed on your machine • Set the source for the 3 scripts ( ) in the Toolbox Right click on each script…then properties
Set-Up • Create a folder for storing your reclassified data • If you have themes, create sub-folders for each theme (eg. Conserve_reclass, etc.) • Set your workspaces - current and scratch folders
Use the Spatial Analyst Toolbar in ArcMap, click Options… Set-Up • Set your analysis mask, extent, cell size, and snap grid • This ensures all your outputs will line up Set your analysis Mask (ex. a Forest-NonForest Layer) Set your extent & snap grid Set your Cell Size
Reclassify • This module allows you to reassign the values of your data layers to a standard scale – 0 to 10 • Allows you to compare and overlay data layers • Use your objectives to determine values • Consult with program managers and experts • Example: For an Insect & Disease layer, you may decide that the highest risk areas are “too far gone” and assign 10’s to areas with medium risk. These are areas with the highest management potential.
Use the + button to add in all your layers Specify which input layer, Reclass, and Output layer by double-clicking in the cells Reclassify • Make sure the layers you are using are added into ArcMap • Click on “Step 1: Reclass Grids” in the Toolbox • This dialog box will come up: Important: Make sure all your Reclassed Grids are in the same Folder
Reclassify • At the Reclassification screen, use a standard 0 to 10 scale for your new values, where 10 refers to values with the highest management potential. • If certain values are constraints, assign them “NoData”. • Constraint example: depending on your management question, you may wish to exclude wilderness areas from the analysis.
Development 65% Conserve Working Forest Lands Woody Biomass 22% Forest Fragmentation 13% 50% Fire Potential Protect Forests From Harm Insect & Disease Risk 50% Critical Habitat 75% Enhance Public Benefit from Trees & Forests Wildland Urban Interface 25% Weighted Overlay • Use the %’s you determined from the worksheet to assign weights to your data layers Assign Weights within each Theme Assign Weights To Themes …if desired. 30% Overall Composite 45% 25%
Weighted Overlay • Make sure the layers you are using are added into ArcMap • Click on “Step 2: Make Overlay Pct Table • Select the Folder where you put your reclassified layers and enter name for a table
Weighted Overlay • This brings up an Excel Table – enter your weights from your worksheet • Save it -if you get a warning, say Yes • Close the file - Say no if it asks to save changes
Weighted Overlay • Click on “Step 3: Perform Weighted Overlay” • Enter the Reclass Workspace, your table from Step 2, and a name for your output
Weighted Overlay • If you are using themes: • Repeat steps 2 & 3 for each theme • Important! Make sure to put all your weighted themes into the same folder • Once you’ve weighted all your themes, repeat steps 2 & 3 pointing to that folder for your final weighted overlay
8-Digit HUC 1km Pixels Aggregate • This module aggregates your analysis to a meaningful management unit: • watersheds, eco-regions, counties, etc. • Difficult to work with “pixels” on a landscape level • An aggregated is a map a better communication tool
1 2 3 4 5 6 7 8 1 2 3 4 5 1 2 3 1 6 High 2 7 3 8 Low Aggregate This tool uses the proportion (%) of management unit instead of the amount of area of concern. Why do it this way? Not Priority Priority To ensure all management units have an equal chance of being represented.
The Help Screen will walk you through the process as you click on each field… Aggregate • Click on “Step 4: Aggregate” • 2 main outputs: • Prioritized map of management units (based on proportion) using 11 equal area categories (0 to 10 scale) • Prioritized map which excludes management units below a user defined threshold value for % forested. • Inputs Required: • weighted overlay, forest mask, aggregation layer, and boundary layer • check if you want to analyze by all acres in the management unit or just the forested acres, and assign a threshold… • Specify threshold value for % forested (default is 10%)
That’s It! • Your final maps are ready to go! • You can also go back and change weights or aggregation units to see how your results are affected • There’s no need to reclassify your data after the initial step
Questions and Support • Please contact James Melonas (jmelonas@fs.fed.us or 202-205-1382) with any questions about using the toolbox. • Also, contact James with any suggestions or ideas for improvements • S&PF National Data Website: source for national datasets and other geo-spatial resources