1 / 1

Expression Analysis of PC-3M Cells under siMIC-1 and Control Conditions at Various Time Points

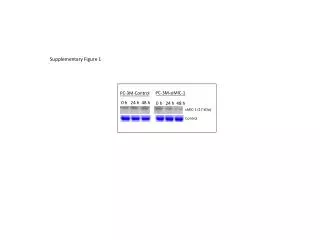
This supplementary figure illustrates the expression levels of MIC-1 (17 kDa) in PC-3M cells subjected to siMIC-1 and control treatments. The data show time-dependent effects at 0, 24, and 48 hours post-treatment. Comparing the siMIC-1 group with the control reveals insights into the role of MIC-1 in prostate cancer cell behavior and response to gene silencing. This analysis enhances our understanding of MIC-1 modulation in PC-3M cells and its potential implications for therapeutic strategies in prostate cancer.

lefty
Download Presentation

Expression Analysis of PC-3M Cells under siMIC-1 and Control Conditions at Various Time Points

An Image/Link below is provided (as is) to download presentation Download Policy: Content on the Website is provided to you AS IS for your information and personal use and may not be sold / licensed / shared on other websites without getting consent from its author. Content is provided to you AS IS for your information and personal use only. Download presentation by click this link. While downloading, if for some reason you are not able to download a presentation, the publisher may have deleted the file from their server. During download, if you can't get a presentation, the file might be deleted by the publisher.

E N D

Presentation Transcript


  1. Supplementary Figure 1 PC-3M-siMIC-1 PC-3M-Control 0 h 24 h 48 h 0 h 24 h 48 h sMIC-1 (17 kDa) Control

More Related