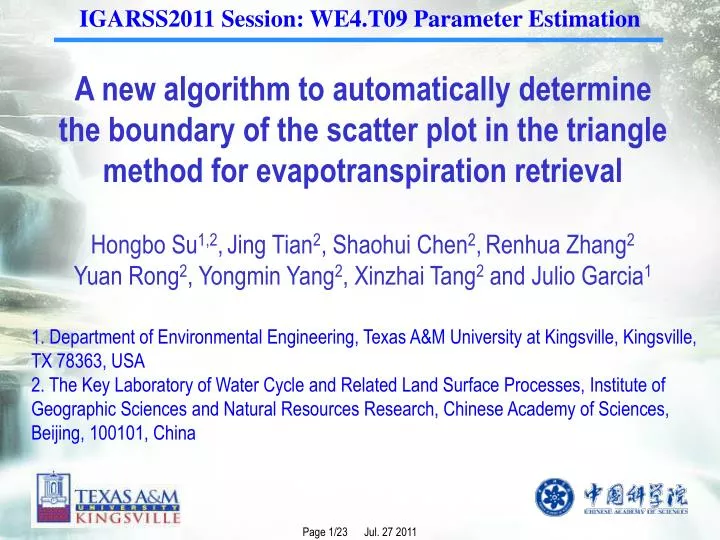

IGARSS2011 Session: WE4.T09 Parameter Estimation
E N D
Presentation Transcript
IGARSS2011 Session: WE4.T09 Parameter Estimation A new algorithm to automatically determine the boundary of the scatter plot in the triangle method for evapotranspiration retrieval Hongbo Su1,2,Jing Tian2, Shaohui Chen2,Renhua Zhang2Yuan Rong2, Yongmin Yang2, Xinzhai Tang2 and Julio Garcia1 1. Department of Environmental Engineering, Texas A&M University at Kingsville, Kingsville, TX 78363, USA 2. The Key Laboratory of Water Cycle and Related Land Surface Processes, Institute of Geographic Sciences and Natural Resources Research, Chinese Academy of Sciences, Beijing, 100101, China
Outline • Background and Motivation • Methodology • Findings and Conclusion
Background and Motivation What is Evapotranspiration? Evapotranspiration (ET) is the combination of water that is evaporated from the surface and transpired by plants as a part of their metabolic processes.
Background and Motivation Importance of the Evapotranspiration Study Potential Applications: Draught and flood monitoring and prediction, water resource management • Water Balance • Surface Energy Balance Weather prediction and climate change detection • Carbon assimilation & ET process are closely related at stomatal level Crop yield estimation, optimal irrigation planning
Terrestrial Evapotranspiration Measurement from Ground Background and Motivation Eddy Correlation System Bowen Ratio System Limitation of the ground measurements: Spatial scale is about tens or hundreds of meters, dependent on the land surface. Instruments can’t be deployed in remote area. Advantage: High Accuracy (10-15%)
Quantifying the land-atmospheric interactions Background and Motivation Opportunity: Make use of the abundant satellite data observed from Space Challenges: Larger scale Global Circulation Model (GCM), regional numerical weather prediction models and Agricultural applications require a globally or regionally distributed ET product to improve the global study and their prediction accuracy. Terra Aqua • However, ground (point) based ET measurement can’t meet the challenges because of: • Limited spatial representativity • Highly cost to maintain a field network
Evapotranspiration Models based on RS Background and Motivation • According to the two most recent review papers by Dr. Li and Dr. McCabe and their colleagues, the ET models based on RS can be categoriized • Surface Energy balanced models, such as SEBS, SEBAL, ALEXI, partition of H and LE • Empirical Regression Models, using minimal inputs, basedon Vegetation Index • Physically based process models, in SVAT, LSM, basically P-M and P-T • Hybrid Models, such as data assimilation in LSM, Triangle Method Jetse D. Kalma, Tim R. McVicar, Matthew F. McCabe , “Estimating Land Surface Evaporation: A Review of Methods Using Remotely Sensed Surface Temperature Data”, Surveys in Geophysics, 2008 Volume 29, Numbers 4-5, 421-469, DOI: 10.1007/s10712-008-9037-z Zhao-Liang Li, Ronglin Tang, Zhengming Wan, et. Al. “Review: A Review of Current Methodologies for Regional Evapotranspiration Estimation from Remotely Sensed Data”, Sensors2009, 9(5), 3801-3853; doi:10.3390/s90503801
Triangle Method Background and Motivation History: Firstly proposed by Justice in 1980’s. Then developed and improved in the recent 3 decades, by Carlson et al., 1981; Wetzel et al., 1983; Carlson et al., 1984; Nemani and Running, 1989; Kustas, 1990; Stewart et al., 1994; Kustas and Norman, 1996; Bastiaanssen et al., 1998; Mecikalski et al, 1999; Petropoulis et al., 2006
Triangle Method Background and Motivation Mo (Soil Moisture Availability) increasing from 0 on the right side (the warm edge). Curved lines labeled as fractions represent the evapotranspiration fraction, EF. Simulated by SVAT Model
Triangle Method Background and Motivation • Revision of the triangle method • The space of Fr and T* can be changed to the space of • Ts v.s. VIs, Ts-Ta v.s. VIs, • Ts v.s. Albedo • Albedo v.s. VIs • VIs can be directly related to Fr using equations similar to: • Limitation: • Much uncertainty in how to determine the dry and wet edge/boundary in the scatter plots. Done manually. • The study area has to be big enough Advantages : Requiring only 2-3 inputs Less computation intensive
Background and Motivation A A Surface Temperature DPWSI PWSI=1 B’ B Actual wet line C PWSI=0 C VFC pixel Fig.1 The scatter plot of DPWSI • Our purpose of this study aims to • Lower the uncertainty of the determination of the dry and wet edge/boundary in the scatter plots, which is the crucial component in the triangle method. • Increase the self-consistency of the estimation from Triangle method. (be repeatable) • Not on the validation of the validation of the triangle method. It was previously done by other scholars.
Methodology • A new algorithm to automatically determine the boundary of the triangle shape in the space of the scatter plot is proposed. • It has to meet the requirement of • maintaining the self-consistency • lowering the subjectivity by minimizing the human interference.
Methodology Three different algorithms were developed to automatically determine the boundary of the triangle shape in the scatter plots. It is assumed that x denotes the variable in the X dimension, y stands for the variable in the Y dimension in the two-dimensional scatter plot, the number of pixel is N and the threshold is α ( 0<α<0.5)
Methodology For the Algorithm I, the procedures are: Linear fitting using all the N pairs of (x, y) and obtaining a line L of y=A+Bx; Solving the intercept of the line L with the Line x=1. Assuming that this intercept is at the point (1, D); Drawing a line L1, whose slope is B and the intercept of L1 with the Line x=1 is (1, D). Obviously, the y-intercept is (0, A); Changing (decreasing) the slope of L1, at the same time, keeping (1, D) on the line L1; Counting the number of points which is below the line L1; assuming the number is n; If the fraction of n to N is less than (1-α), go back to the procedure e); The line L1 is assigned to be the upper boundary of the triangle shape; Drawing a line L2, whose slope is B and the intercept of L2 with the Line x=1 is (1, D). Obviously, the y-intercept is (0, A); Changing (increasing) the slope of L2, at the same time, keeping (1, D) on the line L2; Counting the number of points which is below the line L2; assuming the number is n; If the fraction of n to N is larger than α, go back to the procedure j); The line L2 is assigned to be the lower boundary of the triangle shape;
Methodology For some particular shape of the scatter plot (see Figure on the right, albedo V.S. Vegetation Fraction), the above algorithm couldn’t converge because of the forked shape on the right hand side.
Methodology Therefore, Algorithm II was developed. The Algorithm II is actually a revision based on the Algorithm I. The procedures are Linear fitting using all the N pairs of (x,y) and obtaining a line L of y=A+Bx; Separating the N points in the scatter plot into two groups. The points above the line L will be Group I. The other points will be in Group II. For the points from Group I, apply the Algorithm I. The upper boundary of the whole scatter plot will be determined by that of those points from Group I. For the points from Group II, apply the Algorithm I. The lower boundary of the whole scatter plot will be determined by that of those points from Group II. The threshold level in I and II is 0.05.
Methodology Algorithm III is quite different with the above two. Firstly, the x-y space is divided equally into n (here n is assigned to be 15) domains according to their x values. For vegetation fraction, it is in the range of 0 and 1. Secondly, after sorting the y values in each of the 15 sub-domains, the α and (1-α) quintile of the y values is retrieved. Thirdly, the lower boundary line is fitted using the 15 α quintile y values and the corresponding x values. Similarly, the upper boundary line is fitted using the 15 (1-α) quintile y values and the corresponding x values.
Methodology Figure 2 Albedo V.S. Vegetation Fraction for (a) date 03/14/2006; (b) date03/28/2006 Examples of the determination of the boundary of the scatter plot
Methodology After the boundary of the triangle shape is determined, the standard triangle method is applied to calculate the terrestrial evaporation Heat balance, often used in Hydrology and Meteorology Energy Balance: • Estimation using: • incoming Rswd • downward Rlwd • surface infrared • temperature • emissivity • albedo Radative balance, conveniently estimated by remote sensing Parameterized using fractional vegetation cover
Findings and Conclusion Figure 3 Evapotranspiration estimate for the Northern China Plain based on the new algorithm The study area is the Northern China Plain, which is flat and has a wide range of soil wetness and fractional vegetation cover. MODIS land data products, including land surface temperature, albedo, vegetation index, together with the necessary meteorological variables (mainly the surface downward and upward radiative fluxes) from the GDAS (Global Data Assimilation System) database developed by NOAA/NCEP, are used to test the proposed algorithm.
Three algorithms were developed and compared in this study. The new algorithms have the capability of automatically determining the boundary of the 2-D scatter plots and the results are repeatable. It was found that Algorithm II is better than I, because it can handle the bi-forked shape of the scatter plots. Algorithm III is less computation intensive and has the best overall Findings and Conclusion
Thanks for your attention! Contact Info: Hongbo Su hongbo.su@tamuk.edu hongbo@ieee.org