Download
1 / 28
290 likes | 526 Views
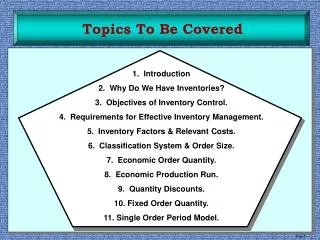
Topics To Be Covered. 1. Introduction 2. Why Do We Have Inventories? 3. Objectives of Inventory Control. 4. Requirements for Effective Inventory Management. 5. Inventory Factors & Relevant Costs. 6. Classification System & Order Size. 7. Economic Order Quantity.

E N D
Topics To Be Covered 1. Introduction 2. Why Do We Have Inventories? 3. Objectives of Inventory Control. 4. Requirements for Effective Inventory Management. 5. Inventory Factors & Relevant Costs. 6. Classification System & Order Size. 7. Economic Order Quantity. 8. Economic Production Run. 9. Quantity Discounts. 10. Fixed Order Quantity. 11. Single Order Period Model.
Introduction Inventory is a stock or store of goods or resources which is anticipated to satisfy a future demand. Independent Inventory:Finished goods that are ready for shipment to the next level customer. (end items) Dependent Inventory:Raw material, components and piece parts that are used in the construction of the final product. TYPES OF INVENTORY: 1. Purchased Goods 2. Partially completed items (WIP) 3. Finished Goods 3. Spare Parts 4. General Supplies 5. Raw Material
Why Do We Have Inventories? 1. To meet anticipated future demand. (Anticipated Inventory) 2. Smooth demand for Production requirements - Seasonal change, work loads, retain stable workforce (Aggregate Plan) 3. Decouple Operations - reduce dependency of one stage on another 4. Protect against stock outs (Safety Stock) - delays in deliveries & unanticipated demand 5. Take advantage of economic order sizes (EOQ); (Cycle Inventory) 6. Hedge against price increases
Requirements For Effective Inventory Management • Management has two basic functions with respect to inventory control • a) establishment of an accounting system • b) decide how much and when to order ( quantity and timing) • 2. Inventory Accounting and Reordering System • a) Periodic vs Continuous • Periodic (P) a physical accounting and ordering of inventory at specific intervals. (retail) • Fixed Order Interval • 2) Continuous (Q) is a running account of inventory on hand and is replenished when a trigger point is reached. (Grocery) • Fixed order Quantity How does Inventory Management Help our Business? Video
Objectives of Inventory Control • 1. Maximize the level of customer satisfaction • right goods, on time in quantities desired • Minimize the cost of providing customer service • Cost of holding inventory • Struggle is to balance these objective • Difficult because customer satisfaction is hard to quantify. • The solution is in defining: • a) timing of restocking (R) • b) size of the order (Q)
Inventory Management Jobs Rapidly growing ammunition manufacturer is seeking an experienced, motivated professional to manage its inventory. Job Description follows: To manage the activities of the inventory control area and provide important support to the purchasing and sales departments of the company. This is a hands-on position that requires active involvement in plant operations and frequent, effective communication with all company departments. Among other responsibilities, the inventory control manager will: 1. Accurately maintain computer records of all goods received and shipments made on a daily basis and all movements of inventory within the plant. Provide daily inventory reports to management. 2. Actively manage the flow of raw materials inventory into production, as driven by work order releases. Oversee physical movement of materials. 3. Coordinate inventory located at offsite contractor sites. 4. Conduct frequent cycle counts to verify accuracy of computer records; conduct a complete physical inventory count quarterly. Monster
Use of P or Q systems • P System • When orders must be placed or delivered at specific intervals. • Grocery stores • When multiple orders must be ordered from the same source and delivered in the same shipment. • For inexpensive items • Inventory level is not monitored closely • Issues: • Increased inventory as it covers the lead time period. • Q System • Use when it is important to continuously track inventory. • Use when ordering only a single part type. • Use when items are expensive
Inventory Factors & Relevant Costs • INVENTORY FACTORS • 1. Demand • Constant vs Variable • Known vs unknown • 2. Lead Time • 3. Review Time • 4. Excess Demand • 5. Obsolescence & Spoilage • RELEVANT COSTS • 1. Purchase Costs • 2. Holding Costs • 3. Ordering/Setup Costs • 4. Shortage Costs
L<T: u * L ROP = L>T: (n*T) u + u * L General Inventory Graph (Instantaneous) Q = IMax Inv u ROP L Time T T: cycle time u: Period usage (daily) L: lead time Q: EOQ reorder size ROP: Reorder Point
Optimal Ordering Graph TC = Holding costs + Ordering Costs + Unit costs TC Holding Costs Min $ Ordering Costs Q* Q Holding CostsOrdering Costs Q Holding CostsOrdering Costs
90% 20% B 5% C 20% 100% 5% Percentage of Total Part numbers A-B-C Classification System • CLASSIFICATION SYSTEM: • A-B-C Approach • 1) Identify the high dollar and high volume items • 2) Track those items which have the greatest impact • 3) Typically 5% of the inventory will represent 90% of the total • inventory costs. Percentage of Total Inventory Value A A
Classification System & Order Size • CLASSIFICATION SYSTEM: • One - Bin System • Two - Bin System • Fixed Ordering Time • HOW MUCH TO ORDER: • There are various methods to define the ordering size. • Most all of them depend upon the relationship between the holding • costs and the ordering costs. • We will Discuss: • - EOQ • - Economic Production Runs • - Quantity Discounts • - Fixed Order Quantity • - Single Period Model
Economic Order Quantity (EOQ) • 1)Assumptions • a. Units are used at a constant rate • b. Minimizes the sum of the annual holding and ordering costs • c. Constant lead time and constant demand. • d. No shortages • e. Optimal ordering quantity is when carrying costs and ordering costs are at a • minimum. • 2) Annual Total cost = ordering costs + holding costs + purchase cost • = D *S + Q * h + C * D • Q 2 • a. EOQ Equation • Q* = 2DS • h • b. Based on relationship between holding and ordering costs • c. h = i * c (fixed vs variable cost); i is the Cost of Capital • d. Derived from finding min of total cost equation (calculus)
Ton Toff Economic Production Runs • 1. When the part is produced inside rather than outside the firm. • 2. Assumes that demand for the part is being used at the same time that it is • being manufactured. • 3. Works only when production rate is greater than demand. • 4. Graph I Max Run time = Run size/Prod Run = Qrun P Inv Max = Run time * Prod rate - Run Time * Demand = [Qrun ] (P-u) = Q run [1 - (u )] P P Total Cost = setup cost + holding costs = D*S + (IC) Q run * (1-u) Q 2 P Run Size = QRun = [ (2DS) 1/2 * ( P )1/2 ] h (P-u)
EOQ vs Prod Run EOQ Production Run Imax Q* = Imax u / P 1-(u / P) Time Time Inventory Inventory 1-(u / P) I Q* Source Source 100% u Direct Usage u / P
Examples • EOQ • A local distributor for a national tire company expects to sell approximately 9600 steel belted radial tires of a certain size and tread design next year. Annual carrying costs are $16 per tire, and ordering costs are $75. The distributor operates 288 days a year. • 1. Determine the EOQ. • 2. How many times per year does the store reorder? • 3. Determine the length of an order cycle. • Production Run • A toy manufacturer uses 48,000 rubber wheels per year for it's popular dump truck series. The firm makes it's own wheels, which it can produce at a rate of 800 per day. The toy trucks are assembled uniformly over the entire year. Carrying cost is $1 per wheel per year. Setup cost for a production run of wheels is $45. The firm operates 240 days per year. • 1. What is the optimal run size? • 2. What is the minimum total annual cost for carrying and setup? • 3. What is the cycle time for the optimal run size? • 4. What is the run time?
Quantity Discounts Used when the purchase price is dependent upon the quantity of a product ordered. The idea is to determine whether the cost of holding the larger amount in inventory is offset by the lower per unit cost and the possible lower ordering costs. The basic EOQ does not consider the purchase cost. 1. The Quantity Discount Graph TC1 $ TC2 TC3 Objective: To minimize total annual costs 2. Feasible Range: The range in which an order size can be placed and be purchased for the desired price. Q*1 Q*2 Q*3
Quantity Discount Method • a) Compute the EOQ • could be different for each price if holding cost is a function of price. • b) Look to see if EOQ(s) fall within the feasible range(s). • c) Compute the Total Cost for each price level. • d) If the EOQ falls within the feasible range then use it in computing total cost. • e) If EOQ is outside feasible range then use the lowest amount that can be • ordered and still receive this lower per unit price. • f) Determine which price gives the lowest total cost. • g) The optimal ordering size is the amount used in the calculation of the • lowest total cost.
Quantity Discounts Example The maintenance department of a large hospital uses 816 cases of liquid cleanser annually. Ordering costs are $12, carrying costs are $4 per case a year, and the new price schedule indicates that orders of less than 50 cases will cost $20 per case, 50 - 79 cases will cost $18 per case, 80-99 cases will cost $17 per case, and larger orders will cost $16 per case. Determine the optimal order quantity and the total cost.
Reorder Point • 1. The reorder point occurs when inventory drops below a designated amount. • 2. As noted earlier the designated amount is defined by the review period. • 3. The reorder point takes into consideration: • a. The degree of acceptable stockout risk c. Length of Lead time • b. The extent of demand and lead time variability d. Demand Rate • 4. We will consider four ROP cases • a. Constant Demand Rate, Constant Lead time • b. Constant Demand Rate, Variable Lead time • c. Variable Demand Rate, Constant Lead time • d. Variable Demand Rate , Variable Lead Time • 5. Safety Stock and Service Level • Service Level is the probability that demand will be met during the lead time. • The amount of safety stock depends on: • a) average demand & average lead time c) demand and lead time variability • b) Assumes variability based on normal distribution d) desired service level
Reorder Point (con’t) Equations: Variable Demand Rate, Constant Lead Time ROP = d * L + Z L d Constant Demand , Variable Lead Time ROP = d* L + Z d L Variable Demand & Variable Lead Time ROP = d * L+ Z (L 2d + d22L) FOQ Reorder Point Example: An automatic burner uses 2.1 gallons of oil per day. Lead time is normally distributed with a mean of six days and a standard deviation of two days. Determine the ROP to have a service level of 98 percent. How much of that quantity is safety stock?
Single Order Period Model • 1.Used to when: • - profit is significantly larger than penalty of a shortage • backorder is not allowed • ordering costs are not significant • no lead time • 2. Can be used for both Continuous and Discrete Demand • 3. Examples are perishable products, limited useful life items • 4. Analysis of a single period focuses on two costs: • Shortage (Cs) • Excess (Ce) • 5. A shortage cost is a lost opportunity cost (profit) • 6. Excess cost is the wholesale price paid for the product less any salvage value.
Single Order Period Model • 6. Objective: Identify the order quantity or stocking level that minimizes the • long run excess and shortage costs. • 7. Continuous Stocking Levels • a. assume demand is uniform and normal • b. Q = d + Z * d • c. From empirical data you know d(avg demand) and (variability of demand) • d. The unknown is the Service level for that product • SL = Cs / (Cs + Ce ) • e. Once you know SL then you can find Z from the normal distribution table. • f. Stockout risk is 1 - SL • g. If the stocking levels falls within a range then use • Q = a + SL (b - a) • (a) is the lower point of the range • (b) is the upper point of the range • 8. Discrete Stocking Levels • a. Assumes that the stocking can only be in discrete units (1,2,3….) • b. Calculate SL • c. Define the Cumulative distribution for the discrete units • d. Select the stocking level where the SL falls in the cumulative distribution
Single Period Examples Single Period Continuous Example Sweet cider is delivered weekly to Pappy's Produce Stand. Demand varies uniformly between 300 liters per week and 500 liters per week. Pappy pays 20 cents per liter and charges 80 cents per liter. Unsold cider has no salvage value and cannot be carried over into the next week due to spoilage. Find the optimal stocking level and it's stock out risk for that quantity? Single Period Discrete Example Historical records on the usage of spare parts for several large hydraulic presses are to be used as an estimate of usage for spares of newly installed press. Stock-out costs involved downtime expenses and special ordering costs. These average $4200 per unit short. Spares cost $800 each, and unused parts have zero salvage. Determine the optimal stocking level. # of spares used Relative Freq Cum Freq 0 .20 . 20 1 .40 60 2 .30 .90 3 .10 1.00 4 or more .00
0 .20 .20 1 .40 .60 2 .30 .90 3 .10 1.00 4 .00 1.00 .90 .80 .70 .60 .50 .40 .30 .20 .10 0 1 2 3 4 Single Period Discrete SL Inventory Level