Download
1 / 34
470 likes | 1.23k Views
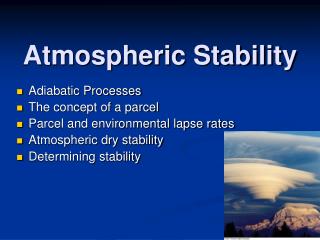
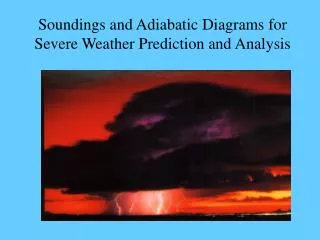
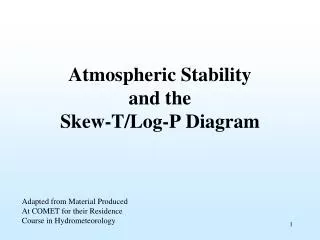
Atmospheric Stability and the Skew-T/Log-P Diagram. Adapted from Material Produced At COMET for their Residence Course in Hydrometeorology. Atmospheric Stability. Stable versus Unstable Dry and Moist Adiabatic Processes Skew-T Log-P Diagrams. Atmospheric Stability (cont.).

E N D
Atmospheric Stabilityand the Skew-T/Log-P Diagram Adapted from Material Produced At COMET for their Residence Course in Hydrometeorology
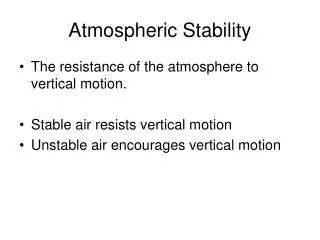
Atmospheric Stability • Stable versus Unstable • Dry and Moist Adiabatic Processes • Skew-T Log-P Diagrams
Atmospheric Stability (cont.) • Stable versus Unstable Stable equilibrium Unstable equilibrium
Atmospheric Stability (cont.) • Adiabatic Processes • Parcel of air expands and cools, or compresses and warms, with no interchange of heat with the surrounding environment • An adiabatic process is reversible • If the parcel doesn’t saturate, then cooling or warming occurs at the dry adiabatic lapse rate • Constant in our atmosphere10 oC / km
Atmospheric Stability (cont.) • If the parcel does saturate and ascent is occurring... • Condensation (RH = 100%), Latent Heat is released • Latent Heating offsets some of the cooling • Cooling at slower rate: moist adiabatic lapse rate • Not constant, varies with temperature and moisture Average value ~ 6 oC / km • Not reversible (heat added, moisture probably removed) • Pseudo-adiabatic process
Atmospheric Stability & Clouds • Stability • Parcel Theory • Characteristics • Expands and Contracts Freely • Remains in as a single unit • No heat exchange with the outside air (Adiabatic) • Adiabatic Process • Expands when lifted due to lessening pressure • Molecular action slows (decreasing kinetic) • Cools at a steady rate • Compresses when forced down • Molecular action increases (increasing kinetic) • Warms at a steady rate
Atmospheric Stability & Clouds • Lapse Rate • Dry Adiabatic Lapse Rate (DALR) – Unsaturated air • 10°C per 1000 meters or 5.5°F per 1000 ft • Moist Adiabatic Lapse Rate (MALR or WALR) – Saturated • 6°C per 1000 meters or 3.3°F per 1000 ft • Effects • As a dry air parcel rises, it cools at the DALR until it reaches its dewpoint and becomes saturated. If parcel continues to rise, then it will cool at the MALR. • As an air parcel sinks, it warms at the DALR due to compressional heating. If the parcel is moist, then it will warm at the MALR for a very short distance and then warm at the DALR for the rest of the sinking moition.
Atmospheric Stability & Clouds • Stability Determinations • Environmental Lapse Rate (ELR) • Not constant – takes into account the lack of conduction the higher you go up • Obtained from a weather balloon sounding • Absolutely stable • Actual sounding temp profile is warmer than the parcel’s temperature. • Parcel is cooler than environment, so it sinks • ELR < MALR…..Why? • A higher lapse rate yields a cooler temp • Causes • Radiational Cooling, Cold Air Advection, Air Crossing a Cold Surface, Sinking (warming) air at upper levels
Atmospheric Stability & Clouds • Neutral Stability • ELR is equal to the DALR or ELR = MALR • Parcel temp the same as the environmental temp • Absolutely Unstable • Actual sounding temp cooler than the parcel temp • Parcel is warmer than the environment around it so it wants to keep rising • ELR > DALR • Conditional Stability • When the environmental temp is between the dry parcel temp and the moist parcel temp • If parcel is unsaturated: then stable • If parcel is saturated: then unstable
Atmospheric Stability & Clouds • Causes of Instability • Daytime heating • Warm air advection • Air moving over a warm surface (conduction) • Cold air advection aloft • Turbulent mixing of atmospheric layers • Can produce an unstable layer • Lifting a layer of air • Convective lifting causes air to cool at the DALR • Other Lifting mechanisms • Fronts (cold air is more dense and forces warm air up) • Mountains (orographic lifting)
Atmospheric Stability & Clouds • Cloud Development • Mechanisms • Surface Heating – Free Convection • Topography • Convergence of Surface Air • Fronts • Process • Ground heated by radiation • Thermal Forms (Convective Updraft) • Air in contact with warmest ground is warmer and therefore less dense than surrounding air • Air rises…..it cools as it rises….it expands due to lessening pressure acting on it.
Atmospheric Stability & Clouds • Parcel of air reaches saturation at some height level • Lifted Condensation Level (LCL) • Cloud droplet formation • Air cools enough so that it is cooler than the surrounding air…..air parcel sinks outside of the cloud • Sets up a Convection Cell or Convective Current • Assumptions • No Mixing between rising air (air parcel) and surroundings (environment) • One thermal updraft = only one cumulus cloud • Cloud forms at 100% Relative Humidity (saturation) • Rising air inside the cloud remains saturated • Entrainment: Mixing of air originally outside of the cloud with saturated air inside the cloud • If outside air is dry: droplets evaporate….cooling process
Atmospheric Stability & Clouds • Lifting by Elevation: Topographic • Orographic • Pronounced uplift on the windward side of a mountain • Responsible for cloudy, wet conditions • Sinking on the Leeward Side • Produces a Rain Shadow effect • Desert-like conditions • Large-Scale Ascending Air • Usually associated with large cyclonic low pressure storms • Cold fronts force warm, moist air to rise over it • Estimating Cumulus Cloud Heights • Use convective cloud height diagram (p. 177)
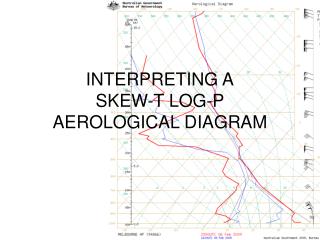
Skew-T Log-P Diagram • Convenient way to look at the vertical structure of the atmosphere • Determine unreported meteorological quantities • Assess parcel stability • Used to display observations or model output • Developed by the U.S. Air Force
Skew-T Log-P Diagram (cont.) • Basic Definitions • mixing ratio (w) • mass of vapor to mass of dry air • saturation mixing ratio (ws) • maximum for a given T and P • wet-bulb temperature (Tw) • equilibrium T when water evaporates from a wetted-bulb thermometer at a rate where latent heat lost is balanced by flow of heat from surrounding warmer air • potential temperature () • temperature of air if brought dry-adiabatically to 1000 mb • vapor pressure (e) • partial pressure of water vapor
Skew-T Log-P Diagram (cont.) • Basic Definitions (cont.) • virtual temperature (Tv) • temperature dry air at pressure P would have so its density equals that of a moist parcel at T and P • dew point temperature (Td) • temperature of a parcel cooled to saturation at constant P • relative humidity • 100 x (mixing ratio / saturation mixing ratio) • specific humidity (q) • mass of vapor to mass of moist air (nearly the same as mixing ratio) • equivalent temperature (Te) • temperature air would have if all of its latent heat were released
Skew-T Log-P Diagram (cont.) • Basic Definitions (cont.) • equivalent potential temperature (e) • temperature of a parcel if all moisture condensed out (latent heat released) then the parcel brought dry-adiabatically to 1000 mb • Convective condensation level (CCL) • Height where rising parcel just becomes saturated (condensation starts) • Convective temperature (Tc) • T that must be reached for a surface parcel to rise to CCL • Lifting condensation level (LCL) • Height where parcel becomes saturated by lifting dry-adiabatically • Level of free convection (LFC) • Height where parcel lifted dry-adiabatically until saturated, then moist-adiabatically, first becomes warmer than the surrounding air
Skew-T Log-P Diagram (cont.) • Basic Definitions (cont.) • Positive area (or CAPE) • Area between the sounding and the moist adiabat that intersects the CCL, above the CCL. Proportional to the amount of energy the parcel gains from the environment. • Negative area (or CIN) • Area between the sounding and the dry adiabat that intersects the CCL, below the CCL. Proportional to the energy needed to move the parcel. • Equilibrium level (EL) • Height where the temperature of a buoyant parcel again becomes equal to the temperature of the environment. • Wet bulb zero • Height above ground where the wet bulb first reaches zero degrees Celsius. This is the level where hail will begin to melt.
Skew-T Diagram Isobars
Skew-T Diagram Isotherms
Skew-T Diagram Dry Adiabats
Skew-T Diagram Moist Adiabats
Skew-T Diagram Saturation Mixing Ratio
EL CAPE + LI LFC CIN Cape Canaveral, FL