Atmospheric Stability
Atmospheric Stability. Stable vs. Unstable Dry and Moist Adiabatic Processes Skew-T diagrams. Atmospheric Stability (cont.). Stable vs. Unstable. Stable equilibrium. Unstable equilibrium. Atmospheric Stability (cont.). Adiabatic Processes

Atmospheric Stability
E N D
Presentation Transcript
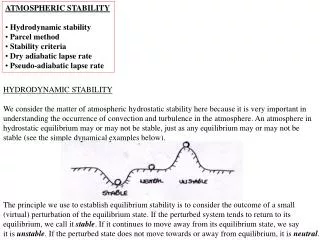
Atmospheric Stability • Stable vs. Unstable • Dry and Moist Adiabatic Processes • Skew-T diagrams
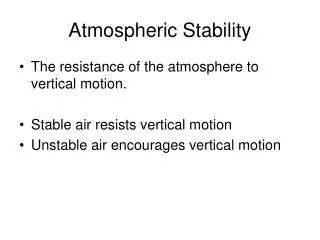
Atmospheric Stability (cont.) • Stable vs. Unstable Stable equilibrium Unstable equilibrium
Atmospheric Stability (cont.) • Adiabatic Processes • Parcel of air expands and cools, or compresses and warms, with no interchange of heat with the surrounding environment • An adiabatic process is reversible • If the parcel doesn’t saturate, cooling or warming occurs at the dry adiabatic lapse rate • Constant in our atmosphere10 oC / km
Atmospheric Stability (cont.) • If the parcel does saturate… • Condensation (RH = 100%), Latent Heat released • Latent Heating offsets some of the cooling • Cooling at slower rate: moist adiabatic lapse rate • Not constant, varies with temperature and moisture Average value ~ 6 oC / km • Not reversible (heat added, moisture probably removed) • Pseudo-adiabatic process
Skew-T diagram • Convenient way to look at the vertical structure of the atmosphere • Determine unreported meteorological quantities • Parcel stability • Observations or model output
Skew-T diagram (cont.) • Basic Definitions • mixing ratio (w) • mass of vapor to mass of dry air • saturation mixing ratio (ws) • maximum for a given T and P • wet-bulb temperature (Tw) • equilibrium T when water evaporates from a wetted-bulb thermometer at a rate where latent heat lost is balanced by flow of heat from surrounding warmer air • potential temperature (2) • temperature of air if brought dry-adiabatically to 1000 mb • vapor pressure (e) • partial pressure of water vapor
Skew-T diagram (cont.) • Basic Definitions (cont.) • virtual temperature (Tv) • temperature dry air at pressure P would have so its density equals that of a moist parcel at T and P • dew point temperature (Td) • temperature of a parcel cooled to saturation at constant P • relative humidity • 100 x (mixing ratio / saturation mixing ratio) • specific humidity (q) • mass of vapor to mass of moist air (nearly the same as mixing ratio) • equivalent temperature (Te) • temperature air would have if all its latent heat were released
Skew-T diagram (cont.) • Basic Definitions (cont.) • equivalent potential temperature (2e) • temperature of a parcel if all moisture condensed out (latent heat released) then the parcel brought dry-adiabatically to 1000 mb • Convective condensation level (CCL) • Height where rising parcel just becomes saturated (condensation starts) • Convective temperature (Tc) • T that must be reached for a surface parcel to rise to CCL • Lifting condensation level (LCL) • Height where parcel becomes saturated by lifting dry-adiabatically • Level of free convection (LFC) • Height where parcel lifted dry-adiabatically until saturated, then moist-adiabaticaly, first becomes warmer than the surrounding air
Skew-T diagram (cont.) • Basic Definitions (cont.) • Positive area (or CAPE) • Area between the sounding and the moist adiabat that intersects the CCL, above the CCL. Proportional to the amount of energy the parcel gains from the environment. • Negative area (or CIN) • Area between the sounding and the dry adiabat that intersects the CCL, below the CCL. Proportional to the energy needed to move the parcel. • Equilibrium level (EL) • Height where the temperature of a buoyant parcel again becomes equal to the environment. • Wet bulb zero • Height above ground where the wet bulb first reaches zero degrees Celsius. This is the level where hail will begin to melt.
Skew-T diagram Isobars
Skew-T diagram Isotherms
Skew-T diagram Dry adiabats
Skew-T diagram Moist adiabats
Skew-T diagram Saturation Mixing Ratio
EL CAPE + LI LFC CIN
Lab 4 Stability Analysis and Soundings
Fronts and Air masses • Air mass types and sources • Frontal types • Frontal structure in 3-D
Fronts and Air masses (cont.) • Air mass types • Four general categories: • P Polar source (also A for Arctic source) • T Tropical source • c continental (land regions) • m maritime (ocean regions) • Source regions • Generally flat and uniform composition • Light surface winds • Places dominated by high pressure • Arctic plains (ice/snow covered) • Subtropical oceans • Desert regions
Fronts and Air masses (cont.) • Air masses of North America: (1) cP and cA Continental Polar and Continental Arctic Cold (very cold in winter) and dry, stable conditions. (2) mPMaritime Polar Cool, moist and somewhat unstable. Forms in polar regions, then moves over oceans. (3) mT Maritime Tropical Very warm and moist. Forms over the eastern Pacific and the Caribbean sea and Gulf of Mexico. (4) cT Continental Tropical Hot, dry, and unstable conditions. Forms over northern Mexico and the southwestern U.S. during the summer.
Fronts and Air masses (cont.) • A front is a transition zone between air masses of different densities. • Frontal types: • Cold front • Zone where colder air is replacing warmer air • Warm front • Zone where warmer air is replacing a retreating colder air mass. • Stationary front • Zone that has little or no movement. • Occlusions • 2 types: Warm and Cold • Occur during mature phase of storm development
Lab 5 Stability Analysis and Soundings (cont.)