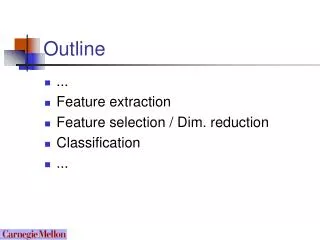

Movable Electrodes & Feature-Based Decoding
E N D
Presentation Transcript
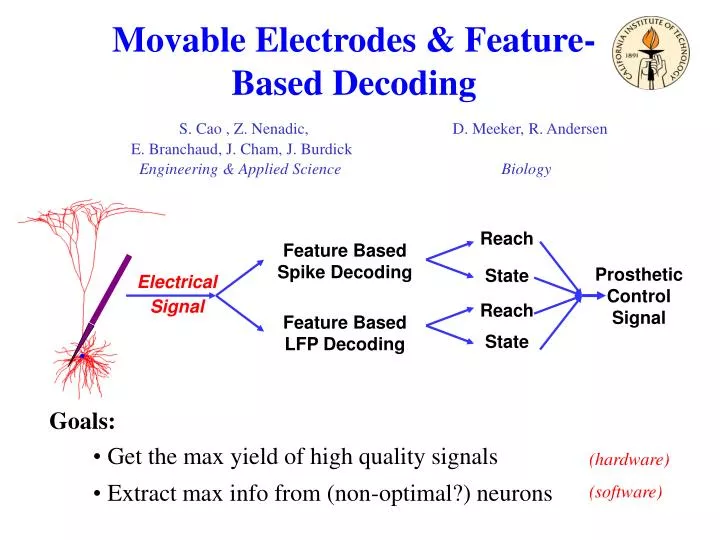
Movable Electrodes & Feature-Based Decoding S. Cao , Z. Nenadic, D. Meeker, R. Andersen E. Branchaud, J. Cham, J. Burdick Engineering & Applied ScienceBiology Reach Feature Based Spike Decoding Prosthetic Control Signal State Electrical Signal Reach Feature Based LFP Decoding State Goals: • Get the max yield of high quality signals • Extract max info from (non-optimal?) neurons (hardware) (software)
Limitations of Neuro-Probes for Chronic Recording Key Challenge: record high quality signals from many neurons for months/years • Fixed positioning of implant • Non-optimal (or wrong!) receptive fields. • Non-optimal cell type • Electrode not near cell body: • Array moves in brain matrix • Inflammation, Gliosis, encapsulation, …
Limitations of Neuro-Probes for Chronic Recording Make the electrodes movable! (autonomously controlled) • Movable electrodes could: • track movement due to migration • improve SNR • overcome implant errors • find “better” neurons • break through encapsulation
Current Research Program Outline • Theory – develop probe control algorithms using computational model • Model extra-cellular neuron potentials • Control algorithm development guided by computational model Experiments– verify theory • Hardware– meso-scale test-beds • Validate concept, evaluate algorithms • Determine spec.s for MEMS devices • Test biomechanics of movable electrodes
soma Single Cell Extracellular Potential Simulation (adapted from Holt & Koch ’98) Laplace equation: Boundary condition: Since solution nearly impossible, use line source approximation (Holt & Koch ‘99) 3720 compartment NEURON pyramidal cell model(adapted from Mainen & Sejnowski ‘96) Synaptic inputs scattered uniformly throughout dendrites.
Virtual experiment Add neural noise
Quality Metric Isolation curve Keep electrode in this region! Peak-to-Peak Amplitude How to find the maximum point of the average isolation curve when all we have are noisy observations?
Solution offered by variant of Stochastic optimization. Basis function approach Iterative Algorithm
Experimental Setup Filters / Preamps • Computer with: • Data Acquisition • Electrode Control algorithm X Move Command Microdrive in the brain
Experimental Results (monkey Parietal Reach Region) Electrode Path Cell Isolation Curve Peak-to-Peak Amplitude Averaged Waveform Electrode Position
Initial State Spikes Detected? T F Move Fixed Move Fixed Spikes Detected No Spikes Detected Algorithmic State Machine
Initial State Spikes Detected? T F Move Fixed Move Fixed Spikes Detected No Spikes Detected Algorithmic State Machine
No Spikes Detected Spikes Detected? T F Move Fixed Move Fixed Spikes Detected Algorithmic State Machine
No Spikes Detected Spikes Detected? T F Move Fixed Move Fixed Spikes Detected Algorithmic State Machine
No Spikes Detected Spikes Detected? T F Move Fixed Move Fixed Spikes Detected Algorithmic State Machine
No Spikes Detected Spikes Detected? T F Move Fixed Move Fixed Spikes Detected Algorithmic State Machine
Spikes Detected Isolation Curve to maximize? T F Move Gradient Move Fixed Maximize Isolation Curve Algorithmic State Machine
Spikes Detected Isolation Curve to maximize? T F Move Gradient Move Fixed Maximize Isolation Curve Algorithmic State Machine
Spikes Detected Isolation Curve to maximize? T F Move Gradient Move Fixed Maximize Isolation Curve Algorithmic State Machine
Spikes Detected Isolation Curve to maximize? T F Move Gradient Move Fixed Maximize Isolation Curve Algorithmic State Machine
Maximize Isolation Curve Is Cell Isolated? T F Do Not Move Move Gradient Maintain Isolation Algorithmic State Machine
Maximize Isolation Curve Is Cell Isolated? T F Do Not Move Move Gradient Maintain Isolation Algorithmic State Machine
Maintain Isolation Is Cell Isolated? T F Regain Isolation Do Not Move Move small Fixed Algorithmic State Machine
Regain Isolation Is Cell Isolated? T F Do Not Move Move small fixed Maintain Isolation Algorithmic State Machine • Re-isolate when signal falls below threshold
Acrylic Skull Dura Brain Tissue Movable Multi-Electrode Testbed “Nanomotors” • sub-micron steps, 1cm range • fits in standard chamber • many adjustments • can insert micro-capillary • Test Multi-electrode issues • Test electrode/fluid combos • gather data for MEMS spec.s Chamber
Bellows Electrode Electrolysis Electrodes Z-Movement Actuator • MEMS Electrolysis Actuator Concept • (with Y.C. Tai) • Large Force Generation • Low Temperature • Low Power • Lockable
Neuron 1 Neuron 2 Neuron 3 Time 5 deg 5 deg Feature Based Bayesian Decoding Characterize receptive Fields In real time, record cell activities Predict movement plan x=argmax[P(x|v)] What features to use?
Decoding the Planned Reach Direction Bayesian Classifier Feature Extraction Firing Rate x-Reach Direction v-Feature
Wavelet Packet Overview Wavelet Packet Tree Haar Wavelet Packet up to Level 14 L H L H Number of spiking in a window (firing rate) Local change of firing rate (slope in PSTH) Local oscillation in spiking train (bursting)
Feature Selection Basis Functions Spike train Goal: select the most informative wavelet bases (features) Solution: choose cost function to quantify the decodability of each feature ) Mutual Information • X is reach class • p(v|X) is conditional probability of feature v given class X
Feature Template t Wavelet Packet Tree Pruning Prune the wavelet packet tree in searching for the most informative features. • Features with large mutual information • Features that are orthogonal to each other
Simple Sanity Check Identified Features • Decode Performance • MFR = 25% • Feature: 91% Poisson Spike Trains with repeatable spikes at specific times
Single neuron decoding comparison(PRR Neuron, left-right reach task) Optimal Feature Mean Firing Rate Optimal Feature Probability Feature Probability Coef value Decoding Performance 68.0% 52.5%
Multiple Neuron Performance Comparison 8-direction decoding using up to PRR 41 neurons (from single electrode acute recordings) 4 neurons with no obvious MFR tuning All 41 available neurons -red MI -blue MFR
Step 1. Estimate the firing rate function from the spike train ensemble • Wavelet thresholding method [Donoho 1994] Projecting Noising Estimation Thresholding Denoising Firing rate function estimation using wavelet thresholding
Step 2: Computing the Theoretical Wavelet Packet Coefficient Distribution If the spike train process is a homogeneous Poisson … Probability even odd Coefficient Value If the spike train process is an inhomogeneous Poisson … Computational method that computes the probabilities exists
Example Distribution of Inhomogeneous Poisson Process (t)=10step(t)+10step(t-256) frequency time NOTE: The error on the probability P*(v) caused by the estimation error of the rate function decays exponentially with the number of spike trains in the ensemble
Step 3. Estimate the empirical distribution of the wavelet packet coefficients • Each wavelet packet coefficient is integer valued • Histogram rule estimation Probability Coefficient Value
Step 4: Goodness-of-fit Test between the Theoretical and Empirical Distributions Use 2 test to assess the difference between the two distributions DOF is the cardinality of the coefficient vjk If p-value > 0.95, the coefficient’s distribution deviates significantly from its Poisson counterpart If p-value < 0.95, both distributions conform
Δt Δt Δt Δt Results Result 1: Cyclic Poisson Process j t = 32 t = 64 Scale
Results (II) Result 2: Brandman-Nelson Non-renewal Model [Brandman 2002] Spike Train j b = 0.5 b = 0.25 Generating Process Scale As slope b decreases, the scale of renewal increases; equivalently, the process becomes more Poisson like.
Poisson Scale-Gram Characterize Poisson-ness at different scales (i.e., is rate coding appropriate?) Coefficient index Time scale Short time-scale non-Poisson-ness Longer time-scale non-Poisson-ness Relatively Poisson Populations of PRR neurons during virtual reach experiments (D. Meeker)
First Experimental Results (monkey Parietal Reach Region) Cell Isolation Curve Electrode Path