
Business Forecasting
E N D
Presentation Transcript
BusinessForecasting Chapter 7 Forecasting with Simple Regression
Chapter Topics • Types of Regression Models • Determining the Simple Linear Regression Equation • Measures of Variation • Assumptions of Regression and Correlation • Residual Analysis • Measuring Autocorrelation • Inferences about the Slope
Chapter Topics (continued) • Correlation—Measuring the Strength of the Association • Estimation of Mean Values and Prediction of Individual Values • Pitfalls in Regression and Ethical Issues
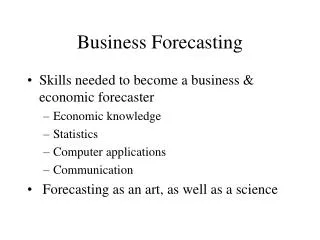
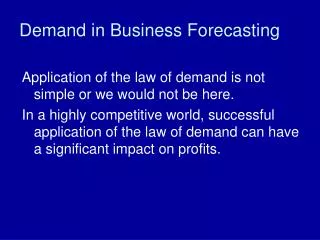
Purpose of Regression Analysis • Regression Analysis is Used Primarily to Model Causality and Provide Prediction • Predict the values of a dependent (response) variable based on values of at least one independent (explanatory) variable. • Explain the effect of the independent variables on the dependent variable.
Types of Regression Models Positive Linear Relationship Relationship NOT Linear Negative Linear Relationship No Relationship
Linear Regression Equation Sample regression line provides an estimate of the population regression line as well as a predicted value of Y. Sample Y Intercept SampleSlopeCoefficient Residual Simple Regression Equation (Fitted Regression Line, Predicted Value)
Simple Linear Regression: Example You wish to examine the linear dependency of the annual sales of produce stores on their sizes in square footage. Sample data for seven stores were obtained. Find the equation of the straight line that best fits the data. Annual Store Square Sales Feet ($1000) 1 1,726 3,681 2 1,542 3,395 3 2,816 6,653 4 5,555 9,543 5 1,292 3,318 6 2,208 5,563 7 1,313 3,760
Scatter Diagram: Example Excel Output
Simple Linear Regression Equation: Example From Excel Printout:
Graph of the Simple Linear Regression Equation: Example Yi = 1636.415 +1.487Xi
Interpretation of Results: Example The slope of 1.487 means that, for each increase of one unit in X, we predict the average of Y to increase by an estimated 1.487 units. The equation estimates that, for each increase of 1 square foot in the size of the store, the expected annual sales are predicted to increase by $1,487.
Simple Linear Regression in Excel • In Excel, use | Regression … • EXCEL Spreadsheet of Regression Sales on Square Footage
Measures of Variation: The Sum of Squares SST =SSR + SSE Total Sample Variability Unexplained Variability = Explained Variability +
Measures of Variation The Sum of Squares: Example Excel Output for Produce Stores Degrees of freedom Regression (explained) df SSR Error (residual) df SSE Total df SST
The Coefficient of Determination • Measures the proportion of variation in Y that is explained by the independent variable X in the regression model.
Measures of Variation: Produce Store Example Excel Output for Produce Stores Syx r2 = 0.94 94% of the variation in annual sales can be explained by the variability in the size of the store as measured by square footage.
Linear Regression Assumptions • Normality • Y values are normally distributed for each X. • Probability distribution of error is normal. • 2. Homoscedasticity (Constant Variance) • 3. Independence of Errors
Residual Analysis • Purposes • Examine linearity • Evaluate violations of assumptions • Graphical Analysis of Residuals • Plot residuals vs. X and time
Residual Analysis for Linearity Y Y X X e e X X Not Linear Linear
Residual Analysis for Homoscedasticity Y Y X X SR SR X X Homoscedasticity Heteroscedasticity
Residual Analysis: Excel Output for Produce Stores Example Excel Output
Residual Analysis for Independence • The Durbin–Watson Statistic • Used when data are collected over time to detect autocorrelation (residuals in one time period are related to residuals in another period). • Measures the violation of the independence assumption Should be close to 2. If not, examine the model for autocorrelation.
Durbin–Watson Statistic in Minitab • Minitab | Regression | Simple Linear Regression … • Check the box for Durbin–Watson Statistic
Obtaining the Critical Values of Durbin–Watson Statistic Finding the Critical Values of Durbin–Watson Statistic
Using the Durbin–Watson Statistic : No autocorrelation (error terms are independent). : There is autocorrelation (error terms are not independent). Inconclusive Reject H0(positive autocorrelation) Reject H0(negative autocorrelation) Accept H0 (no autocorrelation) 0 2 4 dL dU 4-dU 4-dL
Residual Analysis for Independence Graphical Approach Not Independent Independent e e Time Time Cyclical Pattern No Particular Pattern Residual is plotted against time to detect any autocorrelation
Inference about the Slope: t Test • t Test for a Population Slope • Is there a linear dependency of Y on X ? • Null and Alternative Hypotheses • H0: = 0 (No Linear Dependency) • H1: 0 (Linear Dependency) • Test Statistic df = n - 2
Example: Produce Store Data for Seven Stores: Estimated Regression Equation: Annual Store Square Sales Feet ($000) 1 1,726 3,681 2 1,542 3,395 3 2,816 6,653 4 5,555 9,543 5 1,292 3,318 6 2,208 5,563 7 1,313 3,760 The slope of this model is 1.487. Does Square Footage Affect Annual Sales?
H0: = 0 H1: 0 0.05 df7 - 2 = 5 Critical Value(s): Inferences about the Slope: t Test Example Test Statistic: Decision: Conclusion: From Excel Printout Reject H0 Reject Reject 0.025 0.025 There is evidence that square footage affects annual sales. t −2.5706 0 2.5706
Inferences about the Slope: F Test • F Test for a Population Slope • Is there a linear dependency of Y on X ? • Null and Alternative Hypotheses • H0: = 0 (No Linear Dependency) • H1: 0 (Linear Dependency) • Test Statistic • Numerator df=1, denominator df=n-2
Relationship between a t Test and an F Test • Null and Alternative Hypotheses • H0: = 0 (No Linear Dependency) • H1: 0 (Linear Dependency)
Inferences about the Slope: F Test Example Test Statistic: Decision: Conclusion: H0: = 0 H1: 0 0.05 numerator df = 1 denominator df7 − 2 = 5 From Excel Printout Reject H0 Reject There is evidence that square footage affects annual sales. = 0.05 0 6.61
Purpose of Correlation Analysis (continued) • Population Correlation Coefficient (rho) is used to measure the strength between the variables. • Sample Correlation Coefficient r is an estimate of and is used to measure the strength of the linear relationship in the sample observations.
Sample of Observations from Various r Values Y Y Y X X X r = −1 r = −0.5 r = 0 Y Y X X r = 0.5 r = 1
Features of r and r • Unit Free • Range between −1 and 1 • The Closer to −1, the Stronger the Negative Linear Relationship. • The Closer to 1, the Stronger the Positive Linear Relationship. • The Closer to 0, the Weaker the Linear Relationship.
Pitfalls of Regression Analysis • Lacking an Awareness of the Assumptions Underlining Least-squares Regression. • Not Knowing How to Evaluate the Assumptions. • Not Knowing What the Alternatives to Least-squares Regression are if a Particular Assumption is Violated. • Using a Regression Model Without Knowledge of the Subject Matter.
Strategy for Avoiding the Pitfalls of Regression • Start with a scatter plot of X on Y to observe possible relationship. • Perform residual analysis to check the assumptions. • Use a normal probability plot of the residuals to uncover possible non-normality.
Strategy for Avoiding the Pitfalls of Regression (continued) • If there is violation of any assumption, use alternative methods (e.g., least absolute deviation regression or least median of squares regression) to least-squares regression or alternative least-squares models (e.g., curvilinear or multiple regression). • If there is no evidence of assumption violation, then test for the significance of the regression coefficients and construct confidence intervals and prediction intervals.
Chapter Summary • Introduced Types of Regression Models. • Discussed Determining the Simple Linear Regression Equation. • Described Measures of Variation. • Addressed Assumptions of Regression and Correlation. • Discussed Residual Analysis. • Addressed Measuring Autocorrelation.
Chapter Summary (continued) • Described Inference about the Slope. • Discussed Correlation—Measuring the Strength of the Association. • Discussed Pitfalls in Regression and Ethical Issues.