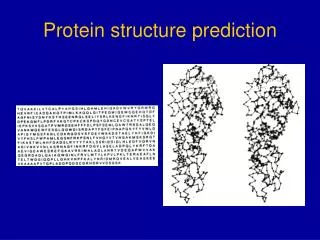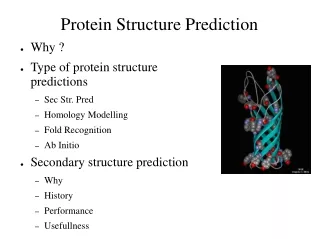

Computational Modeling for Protein Structure Prediction
E N D
Presentation Transcript
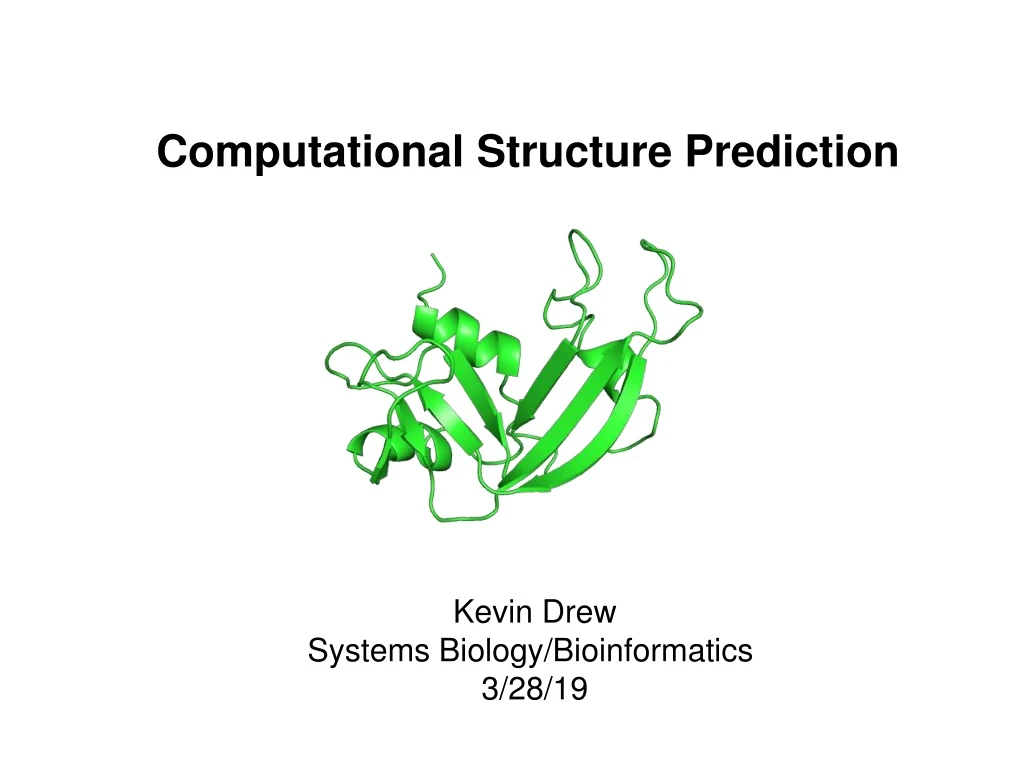
Computational Structure Prediction Kevin Drew Systems Biology/Bioinformatics 3/28/19
Outline Structural Biology Basics Torsion angles, secondary structure, Ramachandranplots Comparative Modeling – create a model for a protein of interest Find templates - HHPRED build model - MODELLER evaluate - PyMol
Protein Data Bank (PDB) http://www.rcsb.org/pdb/ PDBid: 1DFJ Molecules, Resolution, Publication, Download Links, etc. Experimental method: X-ray crystallography NMR Electron Microscopy
What is a 3D structure? Representation of a molecule. Static snapshot of a dynamic object Coordinates Atoms and Bonds ATOM 1 N LYS E 1 15.101 25.279 -11.672 1.00 97.78 N ATOM 2 CA LYS E 1 14.101 24.190 -11.496 1.00 95.96 C ATOM 3 C LYS E 1 13.269 24.511 -10.248 1.00 94.22 C ATOM 4 O LYS E 1 12.861 25.671 -10.051 1.00 94.62 O ATOM 5 CB LYS E 1 14.792 22.807 -11.375 1.00 97.64 C ATOM 6 CG LYS E 1 13.854 21.594 -11.530 1.00102.46 C ATOM 7 CD LYS E 1 14.278 20.409 -10.652 1.00109.05 C ATOM 8 CE LYS E 1 13.220 19.304 -10.681 1.00108.13 C ATOM 9 NZ LYS E 1 13.536 18.165 -9.780 1.00106.31 N Secondary Structure Surface
What is a 3D structure? Atoms and Bonds Red = Oxygen Blue = Nitrogen Green = Carbon Ignore Hydrogens for now R PSI R = 1 of 20 amino acids PHI / PSI rotatable Omega =180 (sometimes 0 for proline) PHI Omega
Phi / Psi torsion angles 0 135 -90 -140
Ramachandran Plot Propensity for phi/psi value combinations (statistics from PDB) Relationship between phi/psi angles and secondary structure S.C. Lovell et al. 2003
Levinthal’s Paradox – thought experiment Want to find lowest energy conformation of a protein (values of all phi and psi angles) RiboA = 124 residues = 123 peptide bonds 2 torsion angles per peptide bond (phi and psi) = 246 degrees of freedom Assume 3 stable conformations per torsion angle = 3^(246) = 10^118 possible states Assume each state takes a picosecond to sample. = 10^20 years to test all states > 13.8 x 10^9 age of universe Proteins take millisecs to microsecs to fold < the age of the universe More importantly, how are we going to do it? Thus a paradox, how do proteins do it?
Structure is more conserved than sequence Chothia, C. and A.M. Lesk, 1986. Structure Similarity Pair of homologues Sequence Similarity Use similar proteins with known structure
Comparative Modeling Predict structure of a protein using the structure of a closely related protein. 1) Identify related proteins with known structure (templates) 2) Align protein sequence with template sequence 3) Build model based on alignment with template 4) Evaluate Eswar et al. 2006
Comparative Modeling Predict structure of a protein using the structure of a closely related protein. Generally both done by the same tool: - Single sequence (previous lectures): ex. Blast - Seqvs Profile = frequencies in multiple seq alignment: ex. PSI-Blast - Profile vs profile: ex. COMPASS - Hidden Markov Models (HMM): ex. HMMER - HMM vs HMM: ex. HHPRED 1) Identify related proteins with known structure (templates) 2) Align protein sequence with template sequence 3) Build model based on alignment with template 4) Evaluate
HHPRED Demo! https://toolkit.tuebingen.mpg.de/#/tools/hhpred Chinchilla Ribonuclease >gi|533199034|ref|XP_005412130.1| PREDICTED: ribonuclease pancreatic [Chinchilla lanigera] MTLEKSLVLFSLLILVLLGLGWVQPSLGKESSAMKFQRQHMDSSGSPSTNANYCNEMMKGRNMTQGYCKP VNTFVHEPLADVQAVCFQKNVPCKNGQSNCYQSNSNMHITDCRLTSNSKYPNCSYRTSRENKGIIVACEG NPYVPVHFDASV
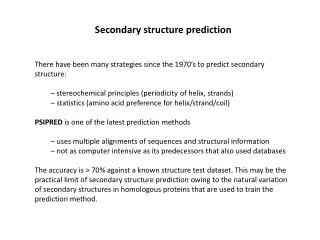
Sequence Profiles Profiles can be built from multiple sequence alignments and contain frequencies of all amino acids in each column. This has more information than a single sequence. Hidden Markov Models (HMM) are like profiles but model insertions and deletions. HHPRED is HMM vs HMM with secondary structure prediction comparisons + Soding 2005
HHPRED Performance
HHPRED Demo! Chinchilla Ribonuclease >gi|533199034|ref|XP_005412130.1| PREDICTED: ribonuclease pancreatic [Chinchilla lanigera] MTLEKSLVLFSLLILVLLGLGWVQPSLGKESSAMKFQRQHMDSSGSPSTNANYCNEMMKGRNMTQGYCKP VNTFVHEPLADVQAVCFQKNVPCKNGQSNCYQSNSNMHITDCRLTSNSKYPNCSYRTSRENKGIIVACEG NPYVPVHFDASV
Comparative Modeling Predict structure of a protein using the structure of a closely related protein. 1) Identify related proteins with known structure (templates) 2) Align protein sequence with template sequence 3) Build model based on alignment with template 4) Evaluate Eswar et al. 2006
3) Build Model: Computational Modeling Representation Sampling Procedures Energy Function Energy = van der Waals (Lennard-Jones) + Implicit Solvent (LK model) + Residue Pair Interactions (PDB) + Hydrogen Bonding + Side chains (Dunbrack) + Torsion Parameters (PDB) Monte Carlo Molecular Dynamics Minimization Simulated Annealing … Molecular Mechanics Knowledge Based (Stats from PDB) Specific knowledge (restraints) Internal Cartesian Full Atom Centroid
MODELLER Modeling by satisfaction of spatial restraints 3) Build model based on alignment with template A. Gather spatial restraints • Residue - Residue distance • Main chain PHI / PSI angles • Solvent Accessibility • Side chain angles • H-bonds • Residue neighborhood • Secondary Structure • B-factor • Resolution of template • … S.C. Lovell et al. 2003 Rost 2007
MODELLER Modeling by satisfaction of spatial restraints https://salilab.org/modeller/ 3) Build model based on alignment with template A. Gather spatial restraints B. Convert restraints to probability density function (pdf) C. Satisfy spatial restraints Sample pdf for model that maximizes probability, P Sample using Molecular Dynamics, Conjugate Gradient Minimization and Simulated Annealing Sali 1993
MODELLER Demo! Chinchilla Ribonuclease >gi|533199034|ref|XP_005412130.1| PREDICTED: ribonuclease pancreatic [Chinchilla lanigera] MTLEKSLVLFSLLILVLLGLGWVQPSLGKESSAMKFQRQHMDSSGSPSTNANYCNEMMKGRNMTQGYCKP VNTFVHEPLADVQAVCFQKNVPCKNGQSNCYQSNSNMHITDCRLTSNSKYPNCSYRTSRENKGIIVACEG NPYVPVHFDASV
Comparative Modeling Predict structure of a protein using the structure of a closely related protein. 1) Identify related proteins with known structure (templates) 2) Align protein sequence with template sequence 3) Build model based on alignment with template 4) Evaluate Eswar et al. 2006
Comparative Modeling 4) Evaluate Eswar et al. 2006
Comparative Modeling 4) Evaluate Common Errors: A. Side Chain packing B. Alignment shift C. No template D. Misalignment E. Wrong template Eswar et al. 2006
Pymol Demo! Chinchilla Ribonuclease >gi|533199034|ref|XP_005412130.1| PREDICTED: ribonuclease pancreatic [Chinchilla lanigera] MTLEKSLVLFSLLILVLLGLGWVQPSLGKESSAMKFQRQHMDSSGSPSTNANYCNEMMKGRNMTQGYCKP VNTFVHEPLADVQAVCFQKNVPCKNGQSNCYQSNSNMHITDCRLTSNSKYPNCSYRTSRENKGIIVACEG NPYVPVHFDASV