Linear Discriminant Analysis
This presentation guide you through Linear Discriminant<br>Analysis, LDA: Overview, Assumptions of LDA and Prepare the data for LDA.<br><br>For more topics stay tuned with Learnbay.

Linear Discriminant Analysis
E N D
Presentation Transcript
Linear Discriminant Analysis Swipe
Linear Discriminant Analysis Linear discriminant analysis is supervised machine learning, the technique used to find a linear combination of features that separates two or more classes of objects or events. Linear discriminant analysis, also known as LDA, does the separation by computing the directions (“linear discriminants”) that represent the axis that enhances the separation between multiple classes. Like logistic Regression, LDA to is a linear classification technique, with the following additional capabilities in comparison to logistic regression.
Linear Discriminant Analysis LDA can be applied to two or more than two-class classification problems. Unlike Logistic Regression, LDA works better when classes are well separated. LDA works relatively well in comparison to Logistic Regression when we have few examples. LDA is also a dimensionality reduction technique. As the name implies dimensionality reduction techniques reduce the number of dimensions (i.e. variables or dimensions or features) in a dataset while retaining as much information as possible.
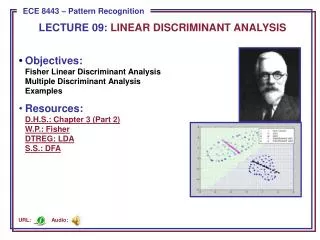
LDA: Overview Linear discriminant analysis (LDA) does classification by assuming that the data within each class are normally distributed: fk (x) = P(X = x|G = k) = N(k,e) We allow each class to have its own mean µk ∈ R p , but we assume a common variance matrix Σ ∈ R p×p . Thus fk(x) = 1 (2π) p/2|Σ| 1/2 exp { 1 2 (x − µk) T Σ −1 (x − µk) } We want to find k so that P(G = k|X = x) ∝ fk(x)πk is the largest.
LDA: Overview The linear discriminant functions are derived from the relation log(fk(x)πk) = − 1 2 (x − µk) T Σ −1 (x − µk) + log(πk) + C = x T Σ −1µk − 1 2 µ T k Σ −1µk + log(πk) + C 0 , and we denote δk(x) = x T Σ −1µk − 1 2 µ T k Σ −1µk + log(πk). The decision rule is G(x) = argmaxk δk(x). The Bayes classifier is a linear classifier.
LDA: Overview We need to estimate the parameters based on the training data xi ∈ R p and yi ∈ {1, · · · , K} by πˆk = Nk/N µˆk = N −1 k P yi=k xi , the centroid of class k Σ =ˆ 1 N−K PK k=1 P yi=k (xi − µˆk)(xi − µˆk) T , the pooled sample variance matrix The decision boundary between each pair of classes k and l is given by {x : δk(x) = δl(x)} which is equivalent to (µk − µˆl) T Σˆ −1x = 1 2 (ˆµk + ˆµl) T Σˆ −1 (ˆµk − µˆl) − log(ˆπk/πˆl).
Assumptions of LDA LDA assumes: Each feature (variable or dimension or attribute) in the dataset is a gaussian distribution. In other words, each feature in the dataset is shaped like a bell-shaped curve. Each feature has the same variance, the value of each feature varies around the mean with the same amount on average. Each feature is assumed to be randomly sampled. Lack of multicollinearity in independent features. Increase in correlations between independent features and the power of prediction decreases.
Assumptions of LDA LDA projects features from higher dimension to lower dimension space, how LDA achieves this, let’s look into: Computes mean vectors of each class of dependent variable Computers with-in class and between-class scatter matrices Computes eigenvalues and eigenvector for SW(Scatter matrix within class) and SB (scatter matrix between class) Sorts the eigenvalues in descending order and select the top k Creates a new matrix containing eigenvectors that map to the k eigenvalues Obtains the new features (i.e. linear discriminants) by taking the dot product of the data and the matrix.
Prepare the data for LDA Machine learning model performance is greatly dependent upon how well we pre-process data. Let’s see how to prepare our data before we apply LDA: Outlier Treatment Equal Variance Gaussian distribution
Topics for next Post Decision tree k-nearest neighbor algorithm Neural Networks Stay Tuned with