Download

1 / 10
100 likes | 262 Views
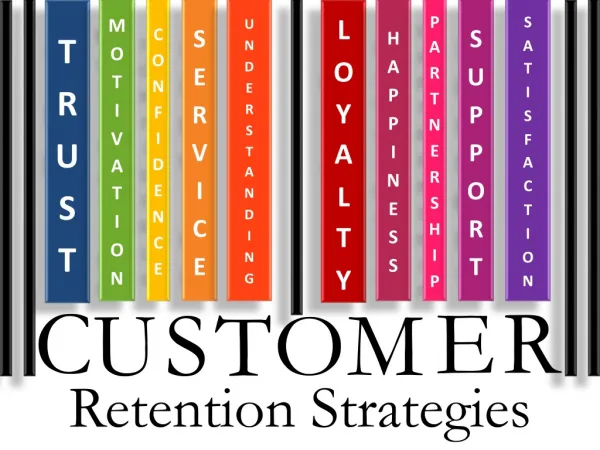
Developing Strategies To Improve Retention, Attendance And Achievement. Lynne Andrews FETN Associate. FETN 2013. This workshop will explore how data can be used to improve retention, attendance and achievement including:.

E N D
Developing Strategies To Improve Retention, Attendance And Achievement Lynne Andrews FETN Associate FETN 2013
This workshop will explore how data can be used to improve retention, attendance and achievement including: How to develop and utilise tools (including data) to improve monitoring and early intervention. Collecting case studies Managing early intervention Identifying key staff to support and manage improvement
Exploring Data: FE Choices & Data Service
Exploring Data Data Service
Keeping up to date with your data Internal – Performance Analyst (MIS, Registers etc) Request reports – if not already generated Ensure reports help you to manage students and systems more effectively Exploring Data
Understanding Data How is it calculated? Retention x Achievement = Success To get retention figure: Retention = number of learners (group or cohort) completing a programme divided by number of starters e.g. : 50 starts minus 10 who left = 40 (40 ÷ 50) x 100 = 80% retention
Achievement is calculated by dividing the number of achievers by completers. Group of 40, six students fail the course this would be: (34 ÷ 40) x100 = 85% Success is therefore: (0.8 x 0.85) x 100 = 68% Understanding Data
Prevention and Intervention Key dates – Start of term and mid term breaks Case studies Regular monitoring e.g. weekly attendance reports Deployment of staff Review data trends Improving Data
People you need to know in your College: College Performance Analyst Management/College Information Systems Quality Manager Teaching and Learning Manager Registry/Timetables Area responsible for recruitment and interviews
Thank you for listening Remember Look after the student and the data will look after itself…