Download
1 / 20
200 likes | 341 Views
Supplementary Figure B-1. Bile acid biosynthesis pathway in Metformin therapy group. Supplementary Figure B-2. Ascorbate and aldarate metabolism pathway in Metformin therapy group. Supplementary Figure B-3. Hepatic Fibrosis-Hepatic Stellate cell activation pathway in Metformin therapy group.

E N D
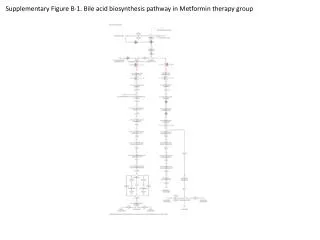
Supplementary Figure B-1. Bile acid biosynthesis pathway in Metformin therapy group
Supplementary Figure B-2. Ascorbate and aldarate metabolism pathway in Metformin therapy group
Supplementary Figure B-3. Hepatic Fibrosis-Hepatic Stellate cell activation pathway in Metformin therapy group
Supplementary Figure B-4. C21-Steroid Hormone Metabolism pathway in Metformin therapy group
Supplementary Figure B-5. Androgen and Estrogen Metabolism pathway in Metformin therapy group
Supplementary Figure B-6. Glycerolipid Metabolism pathway in Metformin therapy group
Supplementary Figure B-7. LPS/IL1 Mediated Inhibition of RXR Function pathway in Metformin therapy group
Supplementary Figure B-8. G-Protein Coupled Receptor Signaling pathway in Metformin therapy group
Supplementary Figure B-9. Human Embryonic Stem cell Pluripotency pathway in Metformin therapy group
Supplementary Figure B-10. FXR/RXR Activation pathway in Metformin therapy group
Supplementary Figure B-11. Hereditary Breast Cancer Signaling pathway in Metformin therapy group
Supplementary Figure B-12. Regulation of eIF4 and p70S6K Signaling pathway in Metformin therapy group
Supplementary Figure B-13. EIF2 Signaling pathway in Metformin therapy group
Supplementary Figure B-14. Pancreatic Adenocarcinoma Signaling pathway in Metformin therapy group
Supplementary Figure B-15. Role of BRCA1 in DNA Damage Receptor pathway in Metformin therapy group
Supplementary Figure B-16. p53 Signaling pathway in Metformin therapy group
Supplementary Figure B-17. Ceramid Signaling pathway in Metformin therapy group
Supplementary Figure B-18. mTOR Signaling pathway in Metformin therapy group
Supplementary Figure B-19. Glucocorticoid Receptor Signaling pathway in Metformin therapy group
Supplementary Figure B-20. Role of CHK Proteins in Cell Cycle Checkpoint Control pathway in Metformin therapy group


