Download
1 / 13
130 likes | 259 Views
The NCSA Visualization Advanced Applications Support Group, led by Dave Bock and Mark Van Moer, facilitates the understanding of complex simulated phenomena through advanced data representation techniques. With expertise in visualizing and analyzing data generated by computational models, the group supports researchers across diverse disciplines, including the imaginative studies of Oscillons and the CyberShake project for seismic hazard analysis in Los Angeles. For more information, visit [NCSA Visualization](http://vis.ncsa.uiuc.edu/) or contact us at dbock@ncsa.uiuc.edu and mvanmoer@ncsa.uiuc.edu.

E N D
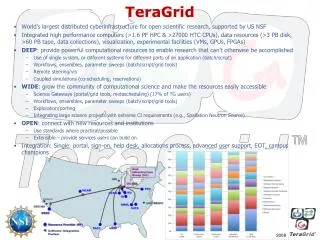
Recent TeraGrid Visualization Support Projects at NCSA Dave Bock and Mark Van Moer Advanced Applications Support Group
NCSA Visualization Advanced Applications Support Group • The mission of the visualization group is to facilitate the understanding of simulated phenomena by applied investigation of data representation techniques. The group is responsible for providing technical expertise and assistance to computational scientists and researchers desiring to represent and analyze data generated by computational models. • http://vis.ncsa.uiuc.edu/ • dbock@ncsa.uiuc.edumvanmoer@ncsa.uiuc.edu Imaginations unbound
Oscillons Visualization • PI - Noah Graham, Middlebury College • Vis – Dave Bock, NCSA Advanced Applications Support • Oscillons – “clumps of waves that oscillate but do not disperse, nonlinear interactions of the field theory model” • TeraGrid being used to scale up to more realistic situations using lattices as large as possible. Imaginations unbound
Oscillons, Contd • Larger lattice – increased oscillon formation • Finer lattice – avoid losing short-wavelength information. • Two data sets: 896^3 and 1024^3 lattice nodes to start. • Uniform grid. • Scalar value per node. • Custom visualization rendering system. Offline, physically based. Imaginations unbound
Oscillons, contd. Perceptual colormapping Slices Volume rendering Imaginations unbound
Oscillons, contd Animation of max value along each ray Imaginations unbound
Oscillons, contd Imaginations unbound
Oscillons, contd. Volume rendering restricted ranges / isosurfacing Imaginations unbound
Cybershake Visualization • PI – Thomas Jordan, POCs – Phil Maechling, Scott Callaghan, Kevin Milner, Robert Graves, Southern California Earthquake Center • Vis – Mark Van Moer, NCSA Advanced Applications Support • “The purpose of the CyberShake Project is to calculate Probabilistic Seismic Hazard curves for several sites in the Los Angeles area.” Imaginations unbound
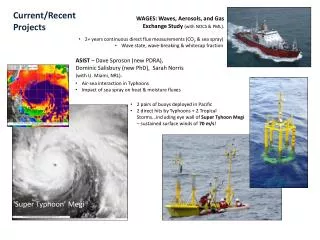
Cybershake, contd. Fault rupture data contains multiple scalars and vectors per node. In particular, the slip velocity indicates fault movement. SCEC image Northridge – 361 nodes San Andreas – 8580 nodes Imaginations unbound
CyberShake, contd. Unsynchronized time data. Each node starts timing based upon when shockwave hits. Number of time steps may vary per node. Time increment may vary per node. Prototyped workflow with Maya/MEL, moving to Maya C++ API Northridge: 8 steps/node San Andreas: 55-108 steps/node Animation of Northridge slip velocities Imaginations unbound
CyberShake, contd. Imaginations unbound
CyberShake, contd • Probabilistic Hazard Maps • Existing maps based on attenuation relationship. Colored to show probability of certain sized seismic event over time. • CyberShake generates hazard curves for geographic locations. • Upcoming run to generate ~200 curves. Goal – compare 200 values against background of 11,000 SCEC Image Imaginations unbound