Quantum Physics
Quantum Physics. 10 hours. The Quantum Nature of Radiation. 13.1 - 13.4. The Photoelectric Effect.


Quantum Physics
E N D
Presentation Transcript
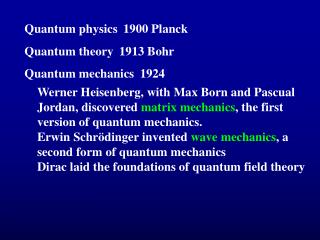
Quantum Physics 10 hours
The Quantum Nature of Radiation 13.1 - 13.4
The Photoelectric Effect • In 1888, Heinrich Hertz carried out an experiment to verify Maxwell’s electromagnetic theory of radiation. Whilst performing the experiment Hertz noted that a spark was more easily produced if the electrodes of the spark gap were illuminated with ultra-violet light.
Hertz paid this fact little heed, and it was left to one of his pupils, Wilhelm Hallswach, to investigate the effect more thoroughly. Hallswach noticed that metal surfaces became charged when illuminated with ultra-violet light and that the surface was always positively charged. He concluded therefore that the ultra-violet light caused negative charge to be ejected from the surface in some manner.
In 1899 Philipp Lenard, another assistant of Hertz, showed that the negative charge involved in the photo-electric effect consisted of particles identical in every respect to those isolated byJ. J. Thomson two years previously, namely, electrons.
The figure below shows schematically the sort of arrangement that might be used to investigate the photo-electric effect in more detail. The tube B is highly evacuated, and a potential difference of about 10 V is applied between anode and cathode. The cathode consists of a small zinc plate, and a quartz window is arranged in the side of the tube such that the cathode may be illuminated with ultraviolet light. The current measured by the micro-ammeter gives a direct measure of the number of electrons emitted at the cathode.
When the tube is dark no electrons are emitted at the cathode and therefore no current is recorded. When ultraviolet light is allowed to fall on the cathode electrons are ejected and traverse the tube to the anode, under the influence of the anode-cathode potential. A small current is recorded by the micro-ammeter. The graph to the right shows a plot of photoelectric current against light intensity for a constant anode-cathode potential. As you would expect, the graph is a straight line and doubling the light intensity doubles the number of electrons ejected at the cathode.
The graph of photoelectric current against light frequency, shown bottom right, is not quite so obvious. The graph shows clearly that there is a frequency of light below which no electrons are emitted. This frequency is called the threshold frequency, fo. Further experiment shows that the value of the threshold frequency is independent of the intensity of the light and also that its value depends on the nature of the material of the cathode.
In terms of wave theory we would expect photo-emission to occur for light of any frequency. For example: consider a very small portion of the cathode, so small in fact that it contains only one electron for photo-emission. If the incident light is a wave motion, the energy absorbed by this small portion of the cathode and consequently by the electron will increase uniformly with time. The amount of energy absorbed in a given time will depend on the intensity of the incident light and not on the frequency. If the light of a given frequency is made very veryfeeble there should be an appreciable time lag during which the electron absorbs sufficient energy to escape from within the metal. No time lag is ever observed.
We now have three surprising observations: • The intensity of the incident light does not affect the energy of the emitted electrons. • The electron energy depends on the frequency of the incident light, and there is a certain minimum frequency below which no electrons are emitted. • Electrons are emitted without a time delay.
The existence of a threshold frequency and spontaneousemission even for light of a very low intensity cannot be explained in terms of a wave theory of light. In 1905 Albert Einstein proposed a daring solution to the problem. Planck had shown that radiation is emitted in pulses, each pulsehaving an energy hf where h is a constant known as the Planck constant and f is the frequency of the radiation. Why, argued Einstein, should these pulses spread out as waves? Perhaps each pulse of radiation maintains a separate identity throughout the time of propagation of the radiation. Instead of light consisting of a train of waves we should think of it as consisting of a hail of discrete energy bundles. On this basis the significance of light frequency is not so much the frequency of a pulsating electromagnetic field, but a measure of the energy of each ‘bundle’ or ‘particle of light’. The name given to these tiny bundles of energy is photon or quantum of radiation.
Einstein’s interpretation of a threshold frequency is that a photon below this frequency has insufficient energy to remove an electron from the metal. • The minimum energy required to remove an electron from the surface of a metal is called the work-function of the metal. The electrons in the metal surface will have varying kinetic energy and so at a frequency above the threshold frequency the ejected electrons will also have widely varying energies. However, according to Einstein’s theory there will be a definite upper limit to the energy that a photo-electron can have.
Suppose we have an electron in the metal surface that needs just φ units of energy to be ejected, where φ is the work function of the metal. A photon of energy hfstrikes this electron and so the electron absorbs hf units of energy. If hf ≥ φ the electron will be ejected from the metal, and if energy is to be conserved it will gain an amount of kinetic energy EK given by EK= hf - φ • Since φ is the minimum amount of energy required to eject an electron from the surface, it follows that the above electron will have the maximum possible kinetic energy. We can therefore write that Ek max= hf - φ or Ek max= hf – hf0 Where f0is the threshold frequency. • Either of the above equations is referred to as the Einstein Photoelectric Equation. It is worth noting that Einstein received the Nobel prize for Physics in 1921 for “his contributions to mathematical physics and especially for his discovery of the law of the photoelectric effect”.
Graphic Representation of Einstein’s Photoelectric Equation Ek max= hf - φ or Ek max= hf – hf0
Millikan’s Experimental Verification of Einstein’s Photoelectric Equation • In 1916 Robert Millikan verified the Einstein photoelectric equation using apparatus similar to that shown in the figure below. Millikan reversed the potential difference between the anode and cathode such that the anode was now negatively charged. Electrons emiited by light shone onto the cathode now face a ‘potential barrier’ and will only reach the anode if they have a certain amount of energy. The situation is analogous to a car freewheeling along the flat and meeting a hill. The car will reach the top of the hill only if its kinetic energy is greater than or equal to its potential energy at the top of the hill.
For the electron, if the potential difference between cathode and anode is Vs (‘stopping potential’) then it will reach the anode only if its kinetic energy is equal to or greater than Vse where e is the electron charge. In this situation, the Einstein equation becomes: Vse = hf – hf0 • Millikan recorded values of the stopping potential for different frequencies of the light incident on the cathode.
For the electron, if the potential difference between cathode and anode is Vs (‘stopping potential’) then it will reach the anode only if its kinetic energy is equal to or greater than Vse where e is the electron charge. In this situation, the Einstein equation becomes: Vse = hf – hf0 • Millikan recorded values of the stopping potential for different frequencies of the light incident on the cathode.
For Einstein’s theory of the photoelectric effect to be correct, a plot of stopping potential against frequency should produce a straight line whose gradient equals h/e. A value for the Planck constant had been previously determined using measurements from the spectra associated with hot objects. • The results of Millikan’s experiment yielded the same value and the photoelectric effect is regarded as the method by which the value of the Planck constant is measured. The modern accepted value is 6.2660693 × 10⁻³⁴ J s. The intercept on the frequency axis is the threshold frequency and intercept of the Vs axis is numerically equal to the work function measured in electron-volt.
Summary The fact that the photoelectric effect gives convincing evidence for the particle nature of light, raises the question as to whether light consists of waves or particles. If particulate in nature, how do we explain such phenomena as interference and diffraction?
Examples • Calculate the energy of a photon in light of wavelength 120 nm. • The photoelectric work function of potassium is 2.0 eV. Calculate the threshold frequency of potassium.
Problems: • Use data from example 2 to calculate the maximum kinetic energy in electron-volts of electrons emitted from the surface of potassium when illuminated with light of wavelength 120 nm. • State and explain two observations associated with the photoelectric effect that cannot be explained by the Classical theory of electromagnetic radiation.
3. In an experiment to measure the Planck constant, light of different frequencies f was shone on to the surface of silver and the stopping potential Vs for the emitted electrons was measured. The results are shown below. Uncertainties in the data are not shown. Vs / V f / 1015 Hz 1.2 0.25 1.6 1.7 2.0 3.3 2.5 5.6 3.0 7.7 3.2 8.4 Plot a graph to show the variation of Vs with f. Draw a line of best-fit for the data points. Use the graph to determine (i) a value of the Planck constant (ii) the work function of silver in electron-volt.