Experimental Engineering: Rocket Flight Analysis
An in-depth study on rocket flights analyzing data from various sensors and comparing results to theoretical models. Includes launch procedures, vibration frequency analysis, and recommendations for enhancements.

Experimental Engineering: Rocket Flight Analysis
E N D
Presentation Transcript
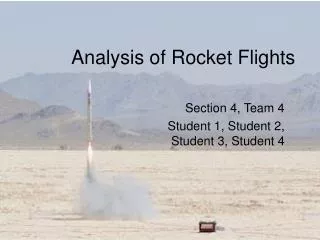
Student 1, Student 2, Student 3, Student 4 Section 3 Team 2 Experimental Engineering: Rocket Flight and Analysis
Intro/Background • E80: Experimental Engineering • Rocket launches on 4/19 and 4/26 • Lucerne Valley dry lake bed • Rockets had various sizes, sensors, and motors • Take data, analyze it, and compare it to theoretical models we developed
Brief Rocket Overview Photo courtesy of Professor Cardenas
Launch Procedures • Configure and verify RDAS • Configure and verify video telemetry • Connect jumpers for vibration sensors • Physical launch preparations • Launch • Recover data
Data Analysis:Large IMU • Inertial Measurement Unit mounted on a large and small rocket • Accelerations • Angular velocities • IMU calibrated with a turntable apparatus • Euler method and rotation used to find global variables
Data Analysis:Large IMU RockSim • Experimental and Theoretical Results IMU Data Flight Model Vertical Position Horizontal Position
Data Analysis :Medium Pressure • Both RDAS and IMU have pressure sensors • Mounted on a medium rocket • Pressure sensors calibrated with a pressure chamber • Altitude can be calculated from pressure
Data Analysis:Medium Pressure RDAS pressure RDAS altitude IMU pressure IMU altitude
Pressure Analysis: Comparison with Theoretical Models Flight Model RDAS IMU RockSim
Models vs. IMU and Pressure Data • Apogees from data consistently lower than predicted apogees from the flight model and RockSim • Calibration error • Launch angle • Dynamic wind vs. static wind
Data Analysis:Large Vibration • Theoretical resonant frequencies, obtained by modeling the rocket as a hollow tube with free-free boundary conditions. • f1 = 165 Hz, f2 = 456 Hz, f3 = 893 Hz. • Expected peaks after folding = 35 Hz, 56 Hz and 93 Hz. E = Young’s modulus, Iz = second moment of the beam, A = cross sectional area of the beam ρ = density ßn= a property dependent on boundary conditions
Resonant peaks also determined by taking data with the DAQ, to get rid of folding. • DAQ data can only be obtained for half of the rocket. • Resonant peak obtained for half-rocket and extended onto the full rocket. • Assumed only parameter changing is length. • First resonant frequency at 178 Hz, which should appear at 22 Hz after folding.
Data Analysis:Large Vibration • Large vibration • Strain gages along the body of the large vibration rocket • Strain gages measure changes in length • The magnitudes of the length changes can be used to determine characteristic vibration
Large vibration • Strain gages along the body of the large vibration rocket • Strain gages measure changes in length • The magnitudes of the length changes can be used to determine characteristic vibration
Data Analysis:Large Vibration • Obtain raw data from the RDAS. • Split up raw data according to events. • Takeoff, ejection charge and deployment, landing. • Perform FFT on each output channel. • Assume the sensor closest to the motor is the input for take off. • Obtain FRF by taking the ratio of the output and the input for the first event of the rocket. • Determine resonance frequencies.
77 Hz 51 Hz 46 Hz
Theoretical Predictions: • Hollow beam model - 165 Hz • DAQ experimental prediction - 178 Hz • Experimental Value - 154 Hz • Difference - 7% • Theoretical Predictions: • Hollow beam model - 456 Hz • Experimental Value - 451 Hz • Difference - 1% • Theoretical Predictions: • Hollow beam model - 893 Hz • Experimental Value - 877 Hz • Difference - 2%
Conclusions • Experimental vibration data matched theoretical model fairly closely • Data from large IMU rocket fit with flight model and RockSim shapes, but differed in altitude • RDAS and IMU data from temperature and pressure rocket agreed with each other, but fit neither of the theoretical models
Recommendations • Change sampling rate of RDAS (200 Hz is too low) • Use low-pass filters to block out unwanted noise • Have more than 6 channels collecting data • Have Global Positioning System onboard rocket for confirmation
Appendix: Data Analysis - Small IMU • Experimental Results • A: x-position • B: y-position • C: z-position
Appendix: Data Analysis - Small IMU • Theoretical Predictions • A: z-position (Rocksim)
Appendix: Data Analysis - Small IMU • Recovery charge did not ignite • Fatal flat spin • Damage to the RDAS
The natural frequency of a hollow tube is given by: E = Young’s modulus, Iz = second moment of the beam, A = cross sectional area of the beam ρ = density ßnL= a property dependent on boundary conditions independent of length.
k k