Download
1 / 8
80 likes | 83 Views
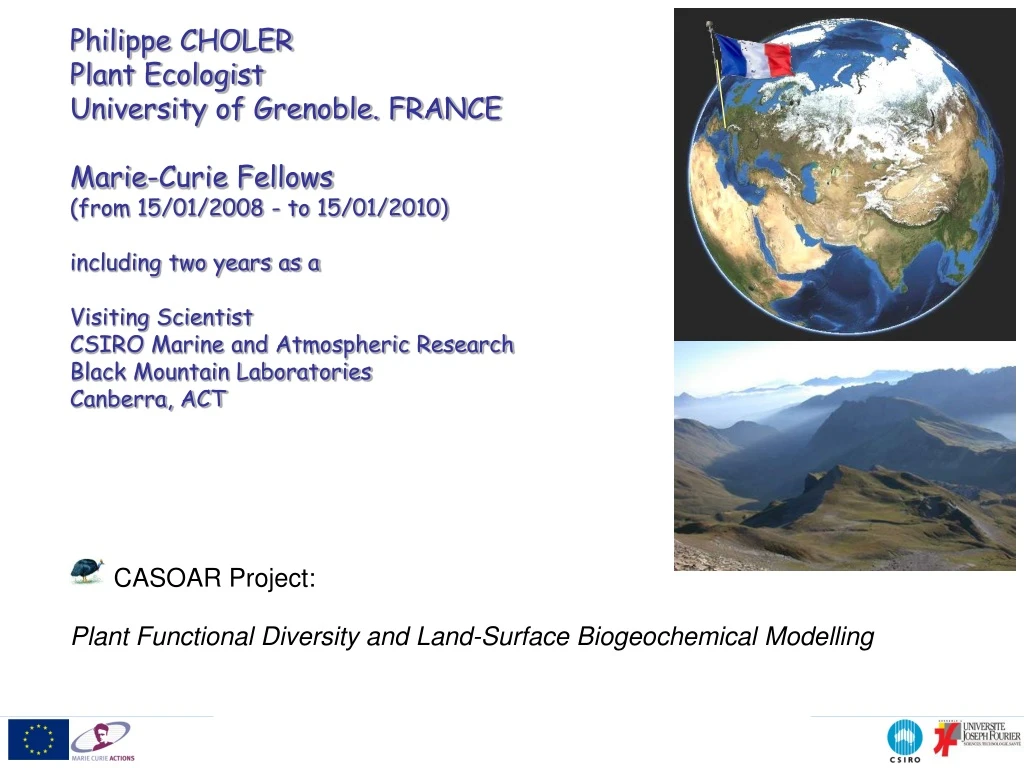
Philippe CHOLER Plant Ecologist University of Grenoble. FRANCE Marie-Curie Fellows (from 15/01/2008 - to 15/01/2010) including two years as a Visiting Scientist CSIRO Marine and Atmospheric Research Black Mountain Laboratories Canberra, ACT.

E N D
Philippe CHOLERPlant EcologistUniversity of Grenoble. FRANCEMarie-Curie Fellows (from 15/01/2008 - to 15/01/2010)including two years as aVisiting ScientistCSIRO Marine and Atmospheric ResearchBlack Mountain LaboratoriesCanberra, ACT CASOAR Project: Plant Functional Diversity and Land-Surface Biogeochemical Modelling
Plants are getting smaller under drier climates (size as a response trait) Tall and Small Plants do not affect the Atmosphere in the same way (size as an effect trait) Species B Tall plant Species A Small plant Plant Functional Ecology (for dummies)
Fundamental trade-offs among leaf traits "glopnet" leaf economics dataset Wright I.J. et al. (2004) Nature Leaf longevity(months) [log scale] Nmass(%) [ log scale] SLA(mm-2 g-1) [ log scale] NOT everything is possible (at least for leaves)
Scaling-up from leaves to canopyCommunity Aggregated Trait = Functional Property of Canopy pi Relative Abundance (Cover) of species i in the community ti Mean Trait Value of species i Basic questions • What are (if existing) the fundamental trade-offs among Community Aggregated Traits ? • How are Community Aggregated Traits spatially distributed ? insights from mechanistic (plant physiology...) and empirical approaches
A case study Rainfall gradient Phosphorus gradient Which are the best predictors of SLACA values ?(Envir. variables or Seasonal Canopy Reflectances)
Sampling sites Use of Remotely Sensed Data Evergreen Broad Leaf Forests Closed Shrublands Open Shrublands Savanna MODIS data : MOD13A1 - level 3(VI products) - Collection 5250m Composite 16 days. (2000-2005) Global Land Cover Class Averaged (3km around measured site) Principal Component Analysis on time series correlation matrix(Data reduction process) Retrieval of n independent Principal Components
Measured vs. Predicted SLACA MODEL 1. RainfallPhosphorusElevation MODEL 2. MODIS time series Principal Components MODEL 3. All explanatory variables Explanatory Variables r2 = 0.55 P(Elevation = 0)= 0.002 P(Slope = 1)= 0.0062 RMSE = 0.12 r2 = 0.64 P(Elevation = 0)= 0.012 P(Slope = 1)= 0.022 RMSE = 0.107 r2 = 0.77 P(Elevation = 0)= 0.07 P(Slope = 1)= 0.09 RMSE = 0.085 (around 1 unit SLA) ModelPerformance (n=43)
Aim: Land-Surface Biogeochemical Models more firmly grounded in ecological knowledge Thank you Conclusion Spatial Distribution Models of CA Traits Community 1 (m1, s1) Remote Sensing Plant Physiology (understqnding trade-offs) Community 2 (m2, s2) Density Trait space Ground Measurements Plant Functional Traits