Download

1 / 21
210 likes | 298 Views
PRICE SURVEY HIGHLIGHTS FOR STAKEHOLDERS MEETING 16-December, 2008. Presentation Outline. Background and Problem statement; To describe the methodology adopted; To share preliminary findings, challenges Overall Recommendations; Way forward & possible interventions for MCA ;.

E N D
PRICE SURVEY HIGHLIGHTS FOR STAKEHOLDERS MEETING 16-December, 2008
Presentation Outline • Background and Problem statement; • To describe the methodology adopted; • To share preliminary findings, challenges • Overall Recommendations; • Way forward & possible interventions for MCA;
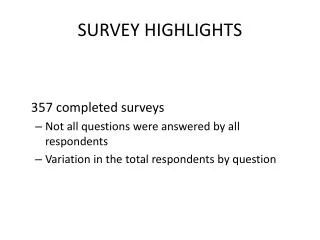
1. Background: • A survey of medicine conducted by KEMSA in FY 2005/06 reported that the public procurement system was achieving very competitive prices (Source: KEMSA 2005/2006 Price Survey Report)
Problem statement & Rationale of the Survey. • There is a possibility that medicines are accessed at different prices by different segments of the population along the public sector supply chain. • The study therefore seeks to explore trends in price variations for medicines accessed from different sources by various segments/points along the supply chain.
2. Survey Design & Methodology Design: • A non-experimental design was employed • Survey methodology was used • Cross-sectional approach was adopted because it allows enormous information to be collected within a short period. Methodology:Goal The overall goal of the survey was to document and compare KEMSA’s prices with the International Reference Prices, MEDS, KNH and local manufacturers and distributors to determine whether KEMSA and Ministry of Medical Services are getting value for money in public procurement.
Methodology: Objectives • To undertake a comparison of KEMSA’s prices with international price reference guide for selected health commodities used in public health facilities. • To compare KEMSA prices with other procuring agents • To compare KEMSA prices with local manufacturers and distributors of health commodities • To undertake price documentation for selected commodities procured locally using Cost sharing funds available at facility level.
Methodology: Sample & Sampling • Selection Criteria: Regional representation; Facilities that undertake local procurement (with FIF) • Survey Sample
Variables and Measurements • Dependent Variable: Prices of Indicator items. • Independent Variables: • Source (IDPIG-International suppliers, Local suppliers, Local manufacturers,) • Supply Chain level (KEMSA, KNH-Referral hospital, PGH, DH) • Region/Province
Measurement • Comparing tender prices of Indicator Items by supplier/source • Comparing prices by ordering point along the supply chain • Comparing KEMSA prices with PPOA prices • Comparing KEMSA prices with those of local manufacturers. • Comparing KEMSA prices with those of local distributors. • Comparing KEMSA price with local procurement at hospitals ( Tender/supplier prices of Indicator Items by source for FY2007/08.)
Tools Development and Pre-testing • TWG: MSH, MOMS, KEMSA • List of Indicator Items defined • Multi-source price survey tool developed with sections for KEMSA, Manufacturers, MEDS/KNH, Wholesalers, Health Facilities • Multi-disciplinary team of 20 data collectors trained. • Pre-testing done in 6 facilities in Nairobi and environs.
Data Collection • 4 teams of 5 people each • 4 supervisors, one per team • Covered 24 facilities/ordering points scattered in all provinces in Kenya • Took 4 weeks
4. Data Analysis • Data captured in Excel Spreadsheets • Data analyzed using simple statistical procedures.
Key Findings: Comparing tender prices of Indicator Items by supplier (source)--- Table1.
Key Findings: Comparing tender prices of Indicator Items by supplier (source)--- Table 2.
Key Findings:Comparing Indicator Item prices by ordering point along the supply chain (Table 3)
Key Findings: Comparing KEMSA Prices with PPOA Price Survey Report (Apr 2008)-- Table 4
Key Findings: Comparing KEMSA Prices with those of local manufacturers and distributors (Table 5)
5. Summary and Recommendations: Summary of Key Findings • There is marked price variation by source • There exists price variations at different points of the supply chain; • KEMSA’S tender prices for 2007/2008 are more competitive than those obtained by the PPOA Survey; • In most cases, KEMSA prices are better than those of manufacturers and suppliers.
5. Summary and Recommendations Overall recommendations • KEMSA appears to be a more efficient procurement agency offering better value for money. • Facilities at different levels of care should procure from KEMSA. • For KEMSA to be the main source, it must improve its efficiency in its overall service delivery. • This price information should be disseminated through the MOMS/MOPHS and KEMSA websites to make it available to sites.
Conclusion • For the most part, KEMSA prices are more competitive than for similar products purchased by health facilities from all the other entities surveyed. • KEMSA is thus achieving value for public funded procurement of medical commodities
Acknowledgements • MoMS/ MoPHS • KEMSA • USAID • MCC • MSH/SPS