Download
1 / 33
360 likes | 559 Views
FOOD CONSUMPTION, MANUFACTURING, AND MARKETING. Food consumption patterns Demographics and trends International comparisons Issues in food markets Food marketing choices. Trend in Food Consumption. Increasing consumption—so far… Pork Chicken Turkey Fish Cheese Fresh fruit

E N D
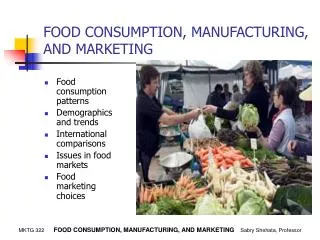
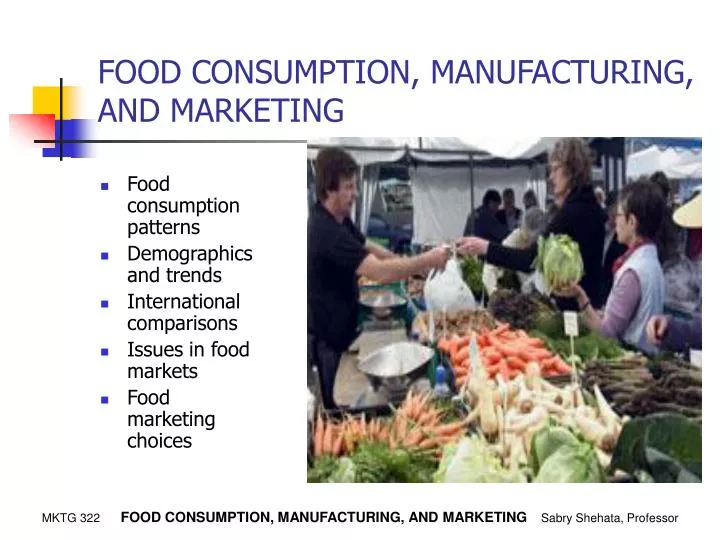
FOOD CONSUMPTION, MANUFACTURING, AND MARKETING • Food consumption patterns • Demographics and trends • International comparisons • Issues in food markets • Food marketing choices
Increasing consumption—so far… Pork Chicken Turkey Fish Cheese Fresh fruit Frozen vegetables Flour and cereal products Soft drinks Declining—so far… Beef Eggs Whole milk Sugar Coffee No evident trend Ice cream Butter, margarine Fruit juices Lamb Fresh potatoes Food Consumption Patterns
Adkins Diet Increases: Beef Butter Cream Nuts Declining Sweetener Frozen potato product Fresh fruit, vegetables Low fat diets Increases Chicken Fish Low fat dairy Fruit Vegetables Decreases Beef, lamb Eggs Sweetened products Possible Effects of
Definition • Demographics: the description of a population in terms its size, distribution, and structure
Population size: number of individuals distribution across a geographic region rural, urban, or suburban Structure age economic stratification occupational distribution status/social class Issues in Demographics
Demographics helps • Understand current markets--demand for products explained in terms of personal characteristics • Predict future markets
U.S. demographic trends • Population increasing (due to immigration) • Increasing average age • More small households • Delay in marriage and children • Fewer children per couple • High rates of divorce • Increasing levels of education • Increasing ethnic diversity • High rates of female workforce participation; dependence on dual incomes
Japanese Demographic and Social Trends • Zero or negative population growth • Low levels of immigration • Graying population • More one child families • Significant delays in marriage and children • High incomes in nominal terms but lower purchasing power • Prolonged economic stagnation • Intense competition for jobs and colleges • Relatively even income distribution • Low regard for many foreign products, but also some desire for “mystique.” • Increasing rates of workforce participation among younger women
Chinese Population Trends • Wide variations across geographic regions • Population growth slowing in most regions due to “one child policy” children become “little emperors” • Highly cyclical economy with generally high growth rates; increasing group of affluent consumers • Migration toward cities • China’s entry into WTO may open the way for agricultural imports
German Demographic and Social Trends • Shrinking population • High tax rates put pressure on income • Trend toward later marriages and fewer children • Distrust of immigration • Imports from other EU countries preferred • High female workforce participation; dual income essential • High levels of welfare and government programs
Demographic and Political Trends in the Middle East • High birth rates • Economies heavily dependent on price of oil; limited economic growth • Large disparities in income in some areas • Limited ability to grow food in desert environments • Food imports dependent on political considerations • Female workforce participation varies
U.S. Food Consumption and Demand • Typical family spends 9-11% of income on food • Decreasing percentage spent with increasing income, but more absolute dollars spent (income elasticity <1) • Immigration has influenced both food preferences and retail formats
Philippines: 56% India: 51% Mexico: 25% (modest incomes, relatively high prices) South Africa: 28% Japan: 18% (very expensive food but high incomes) West Germany: 17% Denmark: 15% (25% sales tax!) France: 15% Netherlands: 11% U.K.: 11% Canada: 10% Comparative Food Spending Percentages, 1994 Percentages of total expenditures—includes non-consumer spending such as government and industry. U.S. figure: 7%
Supermarkets Neighborhood food stores Convenience stores Drug and discount stores Gas stations Vending machines Food stands, street vendors Restaurants Cafeterias Specialty food stores Door-to-door sales Online and catalog orders Some Common U.S. Food Outlets
Some International Characteristics • Japan: Strong emphasis on neighborhood stores, vending machines
Some International Characteristics • Europe: Large food stores are available, some may deliver; government protection of smaller retailers
Some International Characteristics • Developing countries: Food often bought at open markets
Some Food Demand Issues • Income elasticity • Price elasticity • Normal vs. “inferior” goods • Cross-price elasticity • “Trading Up” within select categories • Increased interest in convenience foods • Conflict between demand for healthier and “junk” foods • Unplanned purchases and consumption • “Functional” foods
Some Food Demand Issues • Income elasticity • Normal vs. “inferior” goods All normal goods have positive elasticities of demand; the elasticity of the good is > 1. Inferior goods have negative elasticities of demand. As income rises, the quantity demanded actually falls.
Some Food Demand Issues • Price elasticity Demand for gasoline is inelastic : petrol has no close substitute. If a given change in price causes a larger proportionate change in quantity demanded, then the demand for the good or service is said to be elastic.
Some Food Demand Issues • Cross-price elasticity The cross elasticity of demand for complements is negative. The cross elasticity of of demand for substitutes is a positive number
Some Food Demand Issues • “Trading Up” within select categories
Some Food Demand Issues • Increased interest in convenience foods
Some Food Demand Issues • Conflict between demand for healthier and “junk” foods
Some Food Demand Issues • Unplanned purchases and consumption
Some Food Demand Issues • “Functional” foods Milks enriched with calcium and iron • Eggs containing omega-3 fatty acids/oils • Fermented milk drinks • Breads containing extra fibre, • Fruit juices containing calcium and iron
Some Functional Foods • Fortified foods
Some Functional Foods • “Health” foods • Cranberry juice • Green tea • Soy based foods
Some Functional Foods • Organic foods
Away-From-Home and Prepared Foods • 48% of food expenditures on items eaten away from home (1999) • Large part of restaurant meals is for non-food costs • Labor • Ambiance • Facilities • Increase in take-out foods from restaurants and stores
Public Food Programs • Food stamps were created mostly to promote demand for farm products (thus only American products) • Only a limited amount of food stamp value goes toward increased consumption (cash is diverted elsewhere)