Download
1 / 24
240 likes | 360 Views
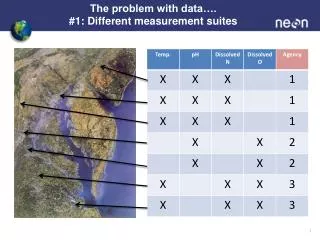
The complexities of ecological research are often exacerbated by varying data measurement suites, spatial and temporal extents, sampling frequencies, and data access methods. Navigating these discrepancies can be time-consuming and poses significant challenges, especially at larger scales like watersheds. The urgency for reliable data is amplified by rapid environmental changes driven by climate change and human impacts. This overview highlights the goals and methodologies of the National Ecological Observatory Network (NEON) as a solution to these challenges, enabling better forecasting and understanding of ecological and climate dynamics.

E N D
The problem with data….#4: Different temporal sampling frequencies
The problem with data….#6: Differences in measurement methods
The problem with data….Combinations of the above! • Finding and manipulating data takes much, much, much, much, longer than expected!!! • How do we address questions at larger scales if it’s hard to do so at a (large) watershed scale? • Especially important given the size of the human footprint on the planetary system.
Life in a Time of Planetary Change Environments are changing rapidly in novel and unexpected ways
The greenhouse gas-ecosystem metabolism feedback loop Biological Drivers of Climate Change: A story about the Arctic The snow – albedo feedback loop Increases in temperature Decreases in snow cover Increases in greenhouse gases Increase in heat absorption Decreases in albedo Increases in growing season length More CO2 released to the atmosphere than sequestered as plant growth Decreases in temperature More CO2 sequestered as plant growth than released to the atmosphere
There exists an ecosystem of Federal environmental observatories (EOs) Long Term Ecological Research (LTER) Smithsonian Global Earth Observatory (SIGEO) National Water Quality Assessment (NAWQA) Ocean Observatories Initiative (OOI) USDA Forest Service Experimental Forests and Ranges Climate Reference Network (CRN)
NEON Goal The goal of NEON is to enableunderstanding and forecasting of the impacts of climate change, land use change and invasive specieson continental-scaleecology by providing infrastructure to support research, education and environmental management in these areas.
Site Schematic Instrumentation Hut Soil Array Keep Out Boundaries Meteorological Tower
Airborne Observation Platform • Airborne Observing Platforms: • ( 3 generating ~40 TB data/yr) • Hyperspectral Spectrometers, waveform LiDAR systems, High precision cameras • Facility for optical calibration and maintenance
Airborne Remote Sensing (AOP) • Spectroscopy • Vegetation biochemical & biophysical properties • Cover type & fraction • LiDAR altimetry • Vegetation structure • Sub-canopy topography • Biomass • High resolution imagery • Land use & land cover