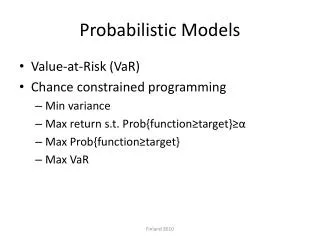
Probabilistic Models
Probabilistic Models. University of Palestine. Operations Research. Queuing Theory. Prepared By :. Sheren Mohammed abo mousa 120060147. Supervisor. Dr . Sana'a. Waiting Line Models. The Structure of a Waiting Line System. Queuing Systems. Queuing System Input Characteristics .

Probabilistic Models
E N D
Presentation Transcript
Probabilistic Models University of Palestine Operations Research Queuing Theory Prepared By : Sheren Mohammed abo mousa 120060147 Supervisor Dr . Sana'a
Waiting Line Models The Structure of a Waiting Line System. Queuing Systems. Queuing System Input Characteristics . Queuing System Operating Characteristics. Analytical Formulas. Examples
Structure of a Waiting Line System • Queuing theory is the study of waiting lines. • Four characteristics of a queuing system are: • the manner in which customers arrive • the time required for service • the priority determining the order of service • the number and configuration of servers in the system.
Structure of a Waiting Line System • In general, the arrival of customers into the system is a random event. • Frequently the arrival pattern is modeled as a Poisson process. • Service time is also usually a random variable. • A distribution commonly used to describe service time is the exponential distribution. • The most common queue discipline is first come, first served (FCFS). • Artificial neuron model is similar • Data inputs (xi) are collected from upstream neurons input to combination function (sigma)
Queuing Systems • A three part code of the form A/B/s is used to describe various queuing systems. • A identifies the arrival distribution, B the service (departure) distribution and s the number of servers for the system. • Frequently used symbols for the arrival and service processes are: M - Markov distributions (Poisson/exponential), D - Deterministic (constant) and G - General distribution (with a known mean and variance). • For example, M/M/k refers to a system in which arrivals occur according to a Poisson distribution, service times follow an exponential distribution and there are k servers working at identical service rates.
Queuing System Input Characteristics = the average arrivalrate 1/ = the averagetimebetween arrivals µ = the average serviceratefor each server 1/µ = the average servicetime =the standard deviation of the servicetime
Queuing System Operating Characteristics P0 = probability the service facility is idle Pn = probability of n units in the system Pw = probability an arriving unit must wait for service Lq = average number of units in the queue awaiting service L = average number of units in the system Wq = average time a unit spends in the queue awaiting service W = average time a unit spends in the system
Analytical Formulas • For nearly all queuing systems, there is a relationship between the average time a unit spends in the system or queue and the average number of units in the system or queue. These relationships, known as Little's flow equations are: L = W and Lq = Wq • When the queue discipline is FCFS, analytical formulas have been derived for several different queuing models including the following: M/M/1, M/M/k, M/G/1, M/G/k with blocked customers cleared, and M/M/1 with a finite calling population.
Example: • M/M/1 Queuing System Joe Ferris is a stock trader on the floor of the New York Stock Exchange for the firm of Smith, Jones, Johnson, and Thomas, Inc. Stock transactions arrive at a mean rate of 20 per hour. Each order received by Joe requires an average of two minutes to process. Orders arrive at a mean rate of 20 per hour or one order every 3 minutes. Therefore, in a 15 minute interval the average number of orders arriving will be = 15/3 = 5.
Example: • Arrival Rate Distribution Question if 12 customer arrive at a bakery every hour , then what is the probability that exactly 5 customers arrive at the bakery in a half _an _ hour time slot ? It is supposed that he arrivals conform to a Poisson distribution . p(x)=e-m .m x/ x! Answer The arrival rate is denoted by and he service rate by µ
Example: • Arrival Rate Distribution We have =12 , t= 0.5 hour Then µ= t = 12(0.5)= 6 hour, e(2.7183) The service rate is determined according to the arrival rate . Prob(5 customers) = P (x = 5) = (e -6 .65)/5! = 1/ (2.7183)6 . 65/120 =64.8/404.96 =0.1600158 = 0.16 approximately
Example: • Service Time Distribution Question What percentage of the orders will take less than one minute to process , = 30 per hour? Answer Since the units are expressed in hours, P (T< 1 minute) = P (T< 1/60 hour). Using the exponential distribution, P (T<t ) = 1 - e-µt. Hence,P (T< 1/60) = 1 - e-30(1/60) = 1 - .6065 =.3935 e=2.7183
Example: • Service Time Distribution Question What percentage of the orders will require more than 3 minutes to process? Answer The percentage of orders requiring more than 3 minutes to process is: P (T > 3/60) = e-30(3/60) = e-1.5 = .2231
Example: • Average Time in the System Question What is the average time an order must wait from the time Joe receives the order until it is finished being processed (i.e. its turnaround time)? Answer This is an M/M/1 queue with = 20 per hour and= 30 per hour. The average time an order waits in the system is: W = 1/(µ - ) = 1/(30 - 20) = 1/10 hour or 6 minutes
Example: • Average Length of Queue Question What is the average number of orders Joe has waiting to be processed? Answer The average number of orders waiting in the queue is: Lq = 2/[µ(µ - )] = (20)2/[(30)(30-20)] = 400/300 = 4/3
Example: Question What percentage of the time is Joe processing orders? Answer The percentage of time Joe is processing orders is equivalent to the utilization factor,/.Thus, the percentage of time he is processing orders is: / = 20/30 = 2/3 or 66.67%
Quiz Question What is the average number of orders Joe has waiting to be processed? = 40 per hour , = 30 per hour
Quiz • Answer The average number of orders waiting in the queue is: Lq = 2/[µ(µ - )] = (30)2/[(40)(40-30)] = 900/400 = 9/4