Probabilistic Graphical Models
This overview explores the fundamentals of probabilistic graphical models (PGMs), a critical tool for representing complex systems through modularity. It discusses how PGMs facilitate sophisticated reasoning and predictions by modeling probability distributions and employing concepts like conditional probability, independence, and expectation. The concepts of random variables, inferences, and sufficient statistics are detailed, providing insights into data-driven decision-making. The document serves as a foundation for anyone interested in the theoretical underpinnings and practical implications of PGMs in statistical analysis and machine learning.

Probabilistic Graphical Models
E N D
Presentation Transcript
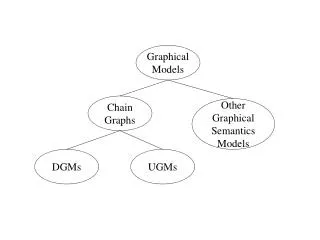
Probabilistic Graphical Models • Tool for representing complex systems and performing sophisticated reasoning tasks • Fundamental notion: Modularity • Complex systems are built by combining simpler parts • Why have a model? • Compact and modular representation of complex systems • Ability to execute complex reasoning patterns • Make predictions • Generalize from particular problem
Probability Theory • Probability distribution P over (, S) is a mapping from events in S such that: • P() 0 for all S • P() = 1 • If ,S and =, then P()=P()+P() • Conditional Probability: • Chain Rule: • Bayes Rule: • Conditional Independence:
Random Variables & Notation • Random variable: Function from to a value • Categorical / Ordinal / Continuous • Val(X) – set of possible values of RV X • Upper case letters denote RVs (e.g., X, Y, Z) • Upper case bold letters denote set of RVs (e.g., X, Y) • Lower case letters denote RV values (e.g., x, y, z) • Lower case bold letters denote RV set values (e.g., x) • Values for categorical RVs with |Val(X)|=k: x1,x2,…,xk • Marginal distribution over X: P(X) • Conditional independence:X is independent of Y given Z if:
Independence assumption Expectation • Discrete RVs: • Continuous RVs: • Linearity of expectation: • Expectation of products:(when X Y in P)
Variance • Variance of RV: • If X and Y are independent: Var[X+Y]=Var[X]+Var[Y] • Var[aX+b]=a2Var[X]
Information Theory • Entropy: • We use log base 2 to interpret entropy as bits of information • Entropy of X is a lower bound on avg. # of bits to encode values of X • 0 Hp(X) log|Val(X)| for any distribution P(X) • Conditional entropy: • Information only helps: • Mutual information: • 0 Ip(X;Y) Hp(X) • Symmetry: Ip(X;Y)= Ip(Y;X) • Ip(X;Y)=0 iff X and Y are independent • Chain rule of entropies:
Distances Between Distributions • Relative Entropy: • D(P॥Q)0 • D(P॥Q)=0 iff P=Q • Not a distance metric (no symmetry and triangle inequality) • L1 distance: • L2 distance: • L distance:
Independent Random Variables • Two variables X and Y are independent if • P(X=x|Y=y) = P(X=x) for all values x,y • Equivalently, knowing Y does not change predictions of X • If X and Y are independent then: • P(X, Y) = P(X|Y)P(Y) = P(X)P(Y) • If X1,…,Xn are independent then: • P(X1,…,Xn) = P(X1)…P(Xn) • O(n) parameters • All 2n probabilities are implicitly defined • Cannot represent many types of distributions
Conditional Independence • X and Y are conditionally independent given Z if • P(X=x|Y=y, Z=z) = P(X=x|Z=z) for all values x, y, z • Equivalently, if we know Z, then knowing Y does not change predictions of X • Notation: Ind(X;Y | Z) or (X Y | Z)
Conditional Parameterization • S = Score on test, Val(S) = {s0,s1} • I = Intelligence, Val(I) = {i0,i1} P(I,S) P(I) P(S|I) Joint parameterization Conditional parameterization 3 parameters 3 parameters Alternative parameterization: P(S) and P(I|S)
Joint parameterization • 223=12-1=11 independent parameters • Conditional parameterization has • P(I,S,G) = P(I)P(S|I)P(G|I,S) = P(I)P(S|I)P(G|I) • P(I) – 1 independent parameter • P(S|I) – 21 independent parameters • P(G|I) - 22 independent parameters • 7 independent parameters Conditional Parameterization • S = Score on test, Val(S) = {s0,s1} • I = Intelligence, Val(I) = {i0,i1} • G = Grade, Val(G) = {g0,g1,g2} • Assume that G and S are independent given I
Biased Coin Toss Example • Coin can land in two positions: Head or Tail • Estimation task • Given toss examples x[1],...x[m] estimateP(H)= and P(T)=1- • Assumption: i.i.d samples • Tosses are controlled by an (unknown) parameter • Tosses are sampled from the same distribution • Tosses are independent of each other
L(D:) 0 0.2 0.4 0.6 0.8 1 Biased Coin Toss Example • Goal: find [0,1] that predicts the data well • “Predicts the data well” = likelihood of the data given • Example: probability of sequence H,T,T,H,H
L(D:) 0 0.2 0.4 0.6 0.8 1 Maximum Likelihood Estimator • Parameter that maximizes L(D:) • In our example, =0.6 maximizes the sequence H,T,T,H,H
Maximum Likelihood Estimator • General case • Observations: MH heads and MT tails • Find maximizing likelihood • Equivalent to maximizing log-likelihood • Differentiating the log-likelihood and solving for we get that the maximum likelihood parameter is:
Sufficient Statistics • For computing the parameter of the coin toss example, we only needed MH and MT since • MH and MT are sufficient statistics
Datasets Statistics Sufficient Statistics • A function s(D) is a sufficient statistics from instances to a vector in k if for any two datasets D and D’ and any we have
Sufficient Statistics for Multinomial • A sufficient statistics for a dataset D over a variable Y with k values is the tuple of counts <M1,...Mk> such that Mi is the number of times that the Y=yi in D • Sufficient statistic • Define s(x[i]) as a tuple of dimension k • s(x[i])=(0,...0,1,0,...,0) (1,...,i-1) (i+1,...,k)
Sufficient Statistic for Gaussian • Gaussian distribution: • Rewrite as • sufficient statistics for Gaussian: s(x[i])=<1,x,x2>
Maximum Likelihood Estimation • MLE Principle: Choose that maximize L(D:) • Multinomial MLE: • Gaussian MLE:
MLE for Bayesian Networks • Parameters • x0, x1 • y0|x0, y1|x0, y0|x1, y1|x1 • Data instance tuple: <x[m],y[m]> • Likelihood X Y Likelihood decomposes into two separate terms, one for each variable
MLE for Bayesian Networks • Terms further decompose by CPDs: • By sufficient statistics where M[x0,y0] is the number of data instances in which X takes the value x0 and Y takes the value y0 • MLE
MLE for Bayesian Networks • Likelihood for Bayesian network • if Xi|Pa(Xi) are disjoint then MLE can be computed by maximizing each local likelihood separately
MLE for Table CPD BayesNets • Multinomial CPD • For each value xX we get an independent multinomial problem where the MLE is
Limitations of MLE • Two teams play 10 times, and the first wins 7 of the 10 matches Probability of first team winning = 0.7 • A coin is tosses 10 times, and comes out ‘head’ 7 of the 10 tosses Probability of head = 0.7 • Would you place the same bet on the next game as you would on the next coin toss? • We need to incorporate prior knowledge • Prior knowledge should only be used as a guide
… X[2] X[M] X[1] Bayesian Inference • Assumptions • Given a fixed tosses are independent • If is unknown tosses are not marginally independent – each toss tells us something about • The following network captures our assumptions
Bayesian Inference • Joint probabilistic model • Posterior probability over … X[2] X[M] X[1] Likelihood Prior For a uniform prior, posterior is the normalized likelihood Normalizing factor
Bayesian Prediction • Predict the data instance from the previous ones • Solve for uniform prior P()=1 and binomial variable
(MH,MT ) = (4,1) 0 0.2 0.4 0.6 0.8 1 Example: Binomial Data • Prior: uniform for in [0,1] • P() = 1 • P(|D) is proportional to the likelihood L(D:) • MLE for P(X=H) is 4/5 = 0.8 • Bayesian prediction is 5/7
Dirichlet Priors • A Dirichlet prior is specified by a set of (non-negative) hyperparameters 1,...k so that ~ Dirichlet(1,...k) if • where and • Intuitively, hyperparameters correspond to the number of imaginary examples we saw before starting the experiment
Dirichlet Priors – Example 5 Dirichlet(1,1) Dirichlet(2,2) 4.5 Dirichlet(0.5,0.5) Dirichlet(5,5) 4 3.5 3 2.5 2 1.5 1 0.5 0 0 0.2 0.4 0.6 0.8 1
Dirichlet Priors • Dirichlet priors have the property that the posterior is also Dirichlet • Data counts are M1,...,Mk • Prior is Dir(1,...k) • Posterior is Dir(1+M1,...k+Mk) • The hyperparameters 1,…,K can be thought of as “imaginary” counts from our prior experience • Equivalent sample size = 1+…+K • The larger the equivalent sample size the more confident we are in our prior
0.55 0.6 Different strength H + T Fixed ratio H / T 0.5 Fixed strength H + T Different ratio H / T 0.5 0.45 0.4 0.4 0.35 0.3 0.3 0.2 0.25 0.1 0.2 0.15 0 0 20 40 60 80 100 0 20 40 60 80 100 Effect of Priors • Prediction of P(X=H) after seeing data with MH=1/4MT as a function of the sample size
MLE Dirichlet(.5,.5) Dirichlet(1,1) Dirichlet(5,5) Dirichlet(10,10) Effect of Priors (cont.) • In real data, Bayesian estimates are less sensitive to noise in the data 0.7 0.6 0.5 P(X = 1|D) 0.4 0.3 0.2 N 0.1 5 10 15 20 25 30 35 40 45 50 1 Toss Result 0 N
General Formulation • Joint distribution over D, • Posterior distribution over parameters • P(D) is the marginal likelihood of the data • As we saw, likelihood can be described compactly using sufficient statistics • We want conditions in which posterior is also compact
Conjugate Families • A family of priors P(:) is conjugate to a model P(|) if for any possible dataset D of i.i.d samples from P(|) and choice of hyperparameters for the prior over , there are hyperparameters ’ that describe the posterior, i.e.,P(:’) P(D|)P(:) • Posterior has the same parametric form as the prior • Dirichlet prior is a conjugate family for the multinomial likelihood • Conjugate families are useful since: • Many distributions can be represented with hyperparameters • They allow for sequential update within the same representation • In many cases we have closed-form solutions for prediction
Parameter Estimation Summary • Estimation relies on sufficient statistics • For multinomials these are of the form M[xi,pai] • Parameter estimation • Bayesian methods also require choice of priors • MLE and Bayesian are asymptotically equivalent • Both can be implemented in an online manner by accumulating sufficient statistics Bayesian (Dirichlet) MLE
This Week’s Assignment • Compute P(S) • Decompose as a Markov model of order k • Collect sufficient statistics • Use ratio to genome background • Evaluation & Deliverable • Test set likelihood ratio to random locations & sequences • ROC analysis (ranking)
Hidden Markov Model • Special case of Dynamic Bayesian network • Single (hidden) state variable • Single (observed) observation variable • Transition probability P(S’|S) assumed to be sparse • Usually encoded by a state transition graph S0 S0 S1 S2 S S’ S3 O0 O1 O2 O’ O3 G G0 Unrolled network
Hidden Markov Model • Special case of Dynamic Bayesian network • Single (hidden) state variable • Single (observed) observation variable • Transition probability P(S’|S) assumed to be sparse • Usually encoded by a state transition graph P(S’|S) S1 S2 S3 S4 State transition representation