Download
1 / 1
10 likes | 189 Views
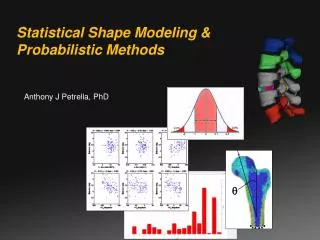
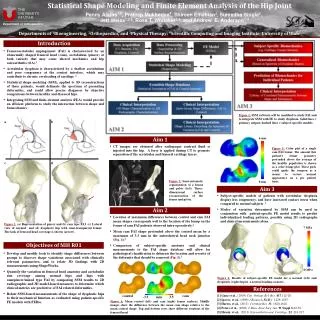
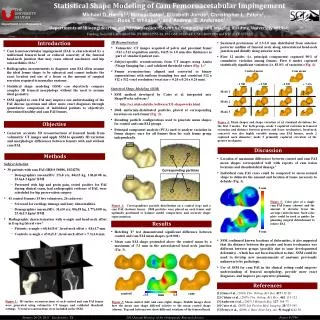
Statistical Shape Modeling of Cam Femoroacetabular Impingement. THE UNIVERSITY OF UTAH. 6 mm. Michael D. Harris 1,2 , Manasi Datar 3 , Elizabeth Jurrus 3 , Christopher L. Peters 2 , Ross T. Whitaker 3 , and Andrew E. Anderson 1,2,3. Department of Orthopaedics.

E N D
Statistical Shape Modeling of Cam Femoroacetabular Impingement THE UNIVERSITY OF UTAH 6 mm Michael D. Harris1,2, Manasi Datar3, Elizabeth Jurrus3, Christopher L. Peters2, Ross T. Whitaker3, and Andrew E. Anderson1,2,3 Department of Orthopaedics Departments of 1Bioengineering and 2Orthopaedics; 3Scientific Computing and Imaging Institute, University of Utah control cam Funding from NIH (R01AR05344, P41RR012553-14, P41 GM103545-14, U54-EB005149) and NSF (CCF-073222) -3.5 mm 3.5 0 mm Introduction • 3D Reconstruction • Volumetric CT images acquired of pelvis and proximal femur (512 x 512 acquisition matrix, 0.625 to 1.0 mm slice thickness) as part of standard patient care. • Subject-specific reconstructions from CT images using Amira (Visage Imaging Inc.) and validated threshold values (Fig. 1).3 • Femur reconstructions aligned and converted to binary segmentations with uniform bounding box and consistent 512 x 512 x 512 voxel resolution (voxel size = 0.24 x 0.24 x 0.24 mm). • Sustained protrusions of 2.5-3.0 mm distributed from anterior-posterior midline of femoral neck along anterolateral head-neck junction and distally along anterior neck. • First 12 modes (i.e. principal components) captured 90% of cumulative variation among femurs. First 6 modes captured statistically significant variation (i.e. 83.8% of variation) (Fig. 4). • Cam femoroacetabular impingement (FAI) is characterized by a malformed femoral head or reduced concavity of the femoral head-neck junction that may cause altered mechanics and hip osteoarthritis (OA).1 • Radiographic measurements to diagnose cam FAI often assume the ideal femur shape to be spherical and cannot indicate the exact location and size of a lesion or the amount of surgical resection required to normalize anatomy. • Statistical shape modeling (SSM) can objectively compare complex 3D femoral morphology without the need to assume ideal geometry. • SSM applied to cam FAI may improve our understanding of the FAI disease spectrum and allow more exact diagnoses through quantitative comparison of individual patients to objectively determined healthy and cam FAI femurs. Control mean Cam mean - 2 SD + 2 SD - 2 SD + 2 SD • Statistical Shape Modeling (SSM) • SSM method developed by Cates et al. integrated into ShapeWorks software.4 • http://sci.utah.edu/cibc/software/131-shapeworks.html • 2048 uniformly-distributed particles placed at corresponding locations on each femur (Fig. 2). • Resulting particle configurations used to generate mean shapes for control and cam FAI groups. • Principal component analysis (PCA) used to analyze variation in femur shapes: once for all femurs then for each femur group independently. Mode 1 Mode 2 Mode 3 Figure 4:Mean shapes and shape variation at ±2 standard deviations for the first 3 modes. For both groups, mode 1 captured variation in femoral extension and distance between greater and lesser trochanters; head-neck concavity was also highly variable among cam FAI femurs; mode 2 captured neck diameter; mode 3 primarily captured curvature of the greater trochanter. Objective • Generate accurate 3D reconstructions of femoral heads from volumetric CT images and apply SSM to quantify 3D variation and morphologic differences between femurs with and without cam FAI. Discussion Methods • Location of maximum differences between control and cam FAI mean shapes corresponded well with reports of cam lesion locations and chondrolabral damage.5 • Individual cam FAI cases could be compared to mean normal shape to delineate the amount and location of tissue necessary to debride (Fig. 5). • Subject Selection • 30 patients with cam FAI (IRB # 56086, 1024270) • Demographics (mean±SD): 27±8 yrs, 84±15 kg, 1.81±0.08 m, 25.6±4.3 kg/m2 BMI. • Presented with hip and groin pain, tested positive for FAI during clinical exam, had radiographic evidence of FAI, were scheduled for hip preservation surgery. • 41 control femurs (15 live volunteers, 26 cadavers) • Screened for cartilage damage and bony abnormalities. • Demographics (mean±SD): 31±10 yrs, 80±18 kg, 1.77±0.08 m, 25.4±5.5 kg/m2 BMI. • Radiographic characterization with α-angle and head-neck offset in frog-leg lateral view2 • Patients: α-angle = 68.4±15.6°, head-neck offset = 4.4±1.7 mm. • Controls: α-angle = 43.0±5.2°, head-neck offset = 7.3±1.6 mm. Figure 5:Color plot of a single cam FAI femur (shown) and the amount it deviates from the average control femur. Such color plots could be used as guides for planning surgical debridement to relieve FAI. Figure 2: Correspondence particle distribution on a control (top) and a cam FAI (bottom) femur. 2048 particles were placed on each femur and optimally positioned to balance model compactness and accurate shape representation. Results • Hotelling T2 test demonstrated significant difference between control and cam FAI mean shapes (p<0.001). • Mean cam FAI shape protruded above the control mean by a maximum of 3.3 mm in the anterolateral head neck junction (Fig. 3). • SSM confirmed known locations of deformities; it also suggested that the distance between the greater and lesser trochanters was different between groups (possibly due to some developmental deformity) - which has not been described to date. SSM could be used to develop new measurements of anatomy previously unknown to be pathologic. • Use of SSM for cam FAI in the clinical setting could improve understanding of femoral morphology, provide more exact diagnoses, and improve pre-operative planning. References [1] Ganz et al., (2003)Clin. Orthop. Rel. Res.417:112-20. [2] Clohisy et al., (2007) Clin. Orthop. Rel. Res., 462: 115-121. [3] Anderson et al., (2005) J BiomechEng, 127: 364-73. [4] Cates et al., (2007) Inf. Process Med. Imaging, 20:333-345. [5] Peters et al., (2009) J. Bone Joint Surg. Am, 91 Suppl 6:42-58. Figure 1: 3D surface reconstructions of each control and cam FAI femur were generated using volumetric CT images and validated threshold settings. 71 total reconstructions were included in the SSM. Figure 3: Mean control (left) and cam (right) shapes. Middle images show how the mean cam shape differed relative to the mean control shape (shown). Top and bottom rows show different rotations of the femoral head. January 26-29, 2013 San Antonio, TX 2013 Annual Meeting of the Orthopaedic Research Society Poster # 1744