Download
1 / 36
440 likes | 818 Views
Integrated control of the cardiovascular system. Integrated control of the cardiovascular system acts to adjust cardiac output to support metabolism in the face of Wide variations in metabolic demands (rest vs. exercise) Diseases that may compromise cardiac or vascular function

E N D
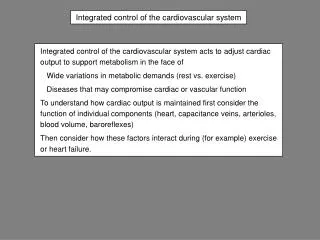
Integrated control of the cardiovascular system Integrated control of the cardiovascular system acts to adjust cardiac output to support metabolism in the face of Wide variations in metabolic demands (rest vs. exercise) Diseases that may compromise cardiac or vascular function To understand how cardiac output is maintained first consider the function of individual components (heart, capacitance veins, arterioles, blood volume, baroreflexes) Then consider how these factors interact during (for example) exercise or heart failure.
Control of the circulation is dependent on the fact that the circulation is a closed loop: cardiac output = venous return. • Changes in cardiac output affect the distribution of blood between the arterial and venous systems. • The relation between CVP and CO is shown by the vascular function curve. • The vascular function curve may be defined by two points: • venous pressure when CO = zero and when CO = 5 L/min. • The vascular function curves are affected by changes in blood volume, venous capacitance, or TPR • The relation between CVP and stroke volume is shown by the cardiac function curve. • The intersection of vascular and cardiac function curves is the equilibrium point for the circulation under a given set of conditions. • The equilibrium point is changed by changes in physiological conditions or disease (for example, exercise or heart failure). Outline
Peripheral resistance 1. Control of the circulation is dependent on the fact that thecirculation is a closed loop: cardiac output = venous return. A closed loop model can be used to show how the venous and arterial systems interact with cardiac output. In the model, for simplicity, the heart and lungs are grouped together as a pump-oxygenator similar to a heart-lung machine. Heart & lungs Venous system Arterial system
Total peripheral resistance (primarily due to arterioles) Cardiac output = 5 L/min Normal volumes & pressures Venous system Pressure = 2 mm Hg Arterial system Pressure = 102 mm Hg Veins contain ~ 67% of blood volume (venules, veins, vena cava) Arteries contain ~ 11% of blood volume (aorta, arteries, arterioles) DP is (102 – 2) = 100 mm Hg
As an extreme example consider the effect of cardiac arrest (CO = zero): • Initially the arteriovenous DP is (102 – 2) = 100 mm Hg. • Blood flows from arteries to veins until at equilibrium DP = zero. • At equilibrium the pressure throughout the circulation = 7 mm Hg. • This equilibrium pressure is called the mean circulatory filling pressure, MCFP. The value of MCFP is set by blood volume & the capacitance of the vascular system (primarily the venous capacitance). • In other words, how much blood is present and how big the “container” (vascular system) is. 2. Changes in cardiac output affect the distribution of blood between the arterial and venous systems. CO = zero When the heart stops, blood flows down the pressure gradient from the arterial to the venous system flow Venous volume Arterial volume
125 100 75 50 25 Arterial pressure Venous pressure Graphical representation of determination of the MCFP Pressure, mm Hg Mean circulatory filling pressure (~ 7 mm Hg) 0 5 Cardiac arrest at t = 0 Seconds Mean circulatory filling pressure is the pressure measured when arterial and venous pressure are equal.
flow Heart begins to beat, CO = 5 L/min Resuscitation reverses the effect of cardiac arrest on vascular pressures & volumes Venous volume & pressure decrease Arterial volume & pressure increase Increasing cardiac output causes blood to shift to the arterial system
CO transfers blood from venous to arterial circulation venous volume arterial volume venous pressure (7 → 2 mm Hg) arterial pressure ( 7 → 102 mm Hg) Heart begins to beat, CO = 5 L/min Effect of restoring CO to normal An isolated increase in CO without any other changes in the circulationdecreases central venous pressure by transferring blood from the venous to the arterial circulation.
6 4 Central venous pressure mm Hg 2 0 1 2 3 4 5 6 4 Cardiac output, L/min 2 0 Minutes 1 2 3 4 5 Measuring CVP at different levels of CO further defines the vascular function curve As cardiac output increases blood shifts to the arterial system & CVP decreases
Venous pressure & capacitance • Venous pressureis determined by the volume of blood in the venous circulation and the capacitance of the venous system. • Venous capacitance is determined by • The structure of the veins and surrounding tissue • Sympathetic nerve activity. • Sympathetic stimulation • constricts veins • decreases venous capacitance • decreases venous compliance (constriction makes vessels stiffer)
CO = zero, MCFP = 7 mm Hg This graph of CVP as a function of CO is a vascular function curve 3. The relation between CVP and CO is shown by the vascular function curve. 7 3a. The vascular function curve may be defined by two points: venous pressure when CO = zero and when CO = 5 L/min. 6 5 4 CO = 5 L/min, CVP = 2 mm Hg Central venous pressure, mm Hg 3 2 1 0 1 2 3 4 5 -1 Cardiac output, L/min
As CO increases, CVP decreases. Hypothetically, at CVP = zero, distending pressure = 0 large veins collapse & CO = 0. Physiologically, CO may increase above 7 L/min due to changes in blood volume or vascular function. Theoretically cardiac output is limited by CVP = zero CO = zero, MCFP = 7 mm Hg 7 6 5 CO = 5 L/min, CVP = 2 mm Hg 4 Central venous pressure, mm Hg 3 CO = 7 L/min, CVP = zero 2 1 0 1 2 3 4 5 6 7 -1 Cardiac output, L/min
Venous pressure = 2 mm Hg Venous pressure = +2 Tissue pressure zero Transmural pressure = +2 Vein is patent Patency of veins depends on transmural pressure If venous pressure & tissue pressure both = zero, then transmural pressure = zero & veins collapse Positive transmural pressure keeps veins open. In the thorax the tissue pressure external to the large veins is negative(negative intrathoracic pressure is a result of normal respiratory function). This negative intrathoracic pressure helps keep the large veins open even if CVP is close to zero.
An increase in blood volume will increase CVP & MCFP; a decrease in blood volume will have the opposite effect. 3b. The vascular function curve is affect by changes in blood volume. 8 MCFP 7 6 Blood volume 5 An increase in blood volume will allow the heart to increase CO 4 Central venous pressure, mm Hg 3 Blood volume 2 1 0 1 2 3 4 5 6 7 8 -1 Cardiac output, L/min
MCFP venomotor tone (decreased capacitance) 8 7 6 When venous capacitance is decreased CVP is higher at any level of CO. 5 Central venous pressure, mm Hg 4 When venous capacitance is increased CVP is lower at any level of CO. 3 2 venomotor tone (increased capacitance) 1 0 1 2 3 4 5 6 7 8 Cardiac output, L/min Sympathetic stimulation decreases capacitance (constricts veins). 3b. Effect of a change in venous capacitance on vascular function
Heart & lungs Venous system Arterial system An increase in TPR without a change in CO decreases CVP QV CO TPR (arterioles) QR 1) Steady state cardiac output = flow across arterioles = flow through veins 2) If TPR (arteriolar constriction) with no change in CO, then flow across resistance (QR) decreases below CO, that is: 3) The heart pumps blood into the arterial system (decreasing venous volume) so arterial pressure increases until QR equals CO 4) The steady state is restored but venous volume and therefore CVP are decreased
1 2 3 4 5 6 7 8 The arterioles contain only a small fraction of the total blood volume so changes in TPR have only a small effect on MCFP 3c. Changes in TPR & the vascular function curve MCFP = 7 mm Hg (not affected by changes in TPR) 8 7 6 TPR (vasodilation) 5 TPR (vasoconstriction) decreases venous volume, lowering CVP. Vasodilation has the opposite effect. 4 Central venous pressure, mm Hg 3 2 TPR (vasoconstriction) 1 0 -1 Cardiac output, L/min
Since the circulation is a closed loop, venous return & cardiac output are equal except for transient responses to perturbations • Mean circulatory filling pressure (MCFP) is set by the blood volume and vascular (mostly venous) capacitance. • CVP is increased by an increase in • Blood Volume • Venomotor Tone (decrease in capacitance due to sympathetic stimulation) • A decrease in arteriolar resistance Summary of factors affecting the vascular function curve
Cardiac function curve Force of contraction or Stroke Volume Initial myocardial fiber length or EDVV or atrial pressure • The Frank-Starling Mechanism: • stretch (preload) • affinity of troponin C for Ca++ force of contraction. • An equivalent statement is: • EDVV stroke volume 4. The relation between CVP and CO is shown by the cardiac function curve (Frank-Starling mechanism) Preload: the degree to which the myocardium is stretched just before contraction. Preload for the right ventricle is estimated as CVP, or right atrial pressure. Preload for the left ventricle is estimated as left atrial pressure by measuring PCWP (Pulmonary capillary wedge pressure) Afterload: the pressure against which blood is ejected from the heart. Afterload for the right ventricle is pulmonary artery pressure during ejection. Afterload for the left ventricle is aortic pressure during ejection. The cardiac function curve is an expression of the Frank Starling mechanism
6 4 CVP CO 2 Frank-Starling Mechanism Vascular function curve 0 1 2 3 4 5 6 CO CVP An increase in cardiac output without any other changes in the circulation, shifts blood from the venous to the arterial vasculature, decreasing venous volume and therefore CVP. An increase in central venous pressure increases right atrial filling pressure, stroke volume and CO. Relationship between CVP and CO • Conditions that challenge the cardiovascular system in the intact organism act via the baroreflex to • increase cardiac output & • constrict capacitance vessels in the venous system • Consequently, CVP may remain constant or increase.
6 CVP 5 4 CO 0 2 4 6 3 2 1 CVP To allow comparison of the vascular and cardiac function curves, the vascular function curve is rotated to put cardiac output on the y axis. Vascular function curve 6 4 CVP 2 0 1 2 3 4 5 6 CO
5. The intersection of vascular and cardiac function curves is the equilibrium point for the circulation under a given set of conditions 6 The intersection is called the equilibrium point. Normally this point is at CO = 5 L/min and CVP = 2 mm Hg. 4 Cardiac output, L/min 2 0 1 2 3 4 5 6 7 -1 Central venous pressure, mm Hg • The location of the equilibrium is determined by: • sympathetic tone • cardiac contractility • blood volume
A: CVP increases B: on the cardiac function curve, CVP CO C: CO CVP (blood transferred from venous to arterial system) D: CVP CO; equilibrium is restored. Changes occur within a few beats. Equilibrium is restored if CVP increases with no change in CO or sympathetic tone. The next five slides show examples of how changes in cardiac or vascular function affect the equilibrium point. C B 6 D A 4 Cardiac output, L/min 2 -1 0 2 6 4 Central venous pressure, mm Hg
In this hypothetical example assume that sympathetic stimulation only affects the heart, not the blood vessels, so there is no change in the vascular function curve. A: sympathetic stimulation increases the contractility ( - - - - ) B: increased CO lowers CVP to the new equilibrium point () At the new equilibrium, CO is greater than before stimulation and CVP is less. contractility An increase in cardiac contractility shifts the cardiac function curve upwards and moves the equilibrium point. A 6 B Cardiac output, L/min 4 2 0 2 4 6 -1 Central venous pressure, mm Hg
Frank Starling Mechanism Cardiac function curve blood volume CVP Stroke Volume atrial pressure End diastolic volume End-diastolic ventricular volume Stroke volume CO CVP is determined by blood volume and venous capacitance. CVP venous pressure & transmural pressure Veins remain open at CO > 7 L/min Effect on CO of transfusing blood into a normal subject
10 blood volume 8 CVP C Blood volume atrial pressure 6 A B Cardiac output, L/min End diastolic volume 4 Stroke volume 2 CO -1 0 2 4 6 8 10 Central venous pressure, mm Hg A: Initial equilibrium point B: Blood volume CVP C: CVP CO () New equilibrium point at higher CO An increase in blood volume shifts the equilibrium point upwards
capacitance CVP atrial pressure End diastolic volume Stroke volume CO CVP is determined by blood volume and venous capacitance. Capacitance is capacity, i.e. the capacity of the venous system. capacitance → venous transmural pressure Veins remain open at CO > 7 L/min A decrease in venous capacitance increases CO • Venous capacitance is determined by • The structure of the veins and surrounding tissue • Sympathetic nerve activity. • Sympathetic stimulation constricts veins (increases venomotor tone) and decreases venous capacitance. The effect of a decrease in venous capacitance is similar to the effect of an increase in blood volume. The equilibrium point is shifted upward along the cardiac function curve to a higher cardiac output.
Cardiac output is increased by an isolated increase in Central venous pressure Cardiac contractility Venomotor tone Blood volume total peripheral conductance. Central venous pressure is increased by an isolated Decrease in cardiac output Increase in venomotor tone Increase in blood volume Decrease in total peripheral resistance Summary: effect of isolated interactions between vascular function & cardiac output It would appear that: CO CVP CO If this were correct how can CO be increased in response to metabolic demands? These are isolated effects; in the intact organism CO increases with increased metabolic demand and CVP remains constant or increases.
Muscular activity Central nervous system Muscle blood flow HR, contractility, ejection fraction Sympathetic activity TPR Cardiac output Venomotor tone Arterial pressure Venous capacitance Venous volume Mobilize venous reservoirs CVP In response to exercise, changes in the cardiovascular system act to maintain or increase CVP and increase cardiac output. Integrated response of CO & CVP to increased metabolic demand
Rt atrium Lft atrium Lft ventricle Rt ventricle systemic circulation pulmonary arteries systemic veins pulmonary capillaries pulmonary veins The right ventricle: Drives blood through the pulmonary circulation at the same rate that blood is delivered from the systemic veins & Provides sufficient pulmonary venous & left atrial pressure to allow an equal rate of pumping from the left ventricle. Interaction of right and left ventricles Normal values: Right atrial pressure ~ 2 - 7 mm Hg (recumbent) Left atrial pressure ~ 5 – 10 mm Hg Higher left atrial pressure provides the necessary preload to pump the CO against the systemic arterial pressure (afterload). Left ventricular failure produces symptoms related to increased pulmonary venous volume & pressure Right ventricular failure produces symptoms related to increased systemic venous volume and pressure
A: normal equilibrium point B: Cardiac output Arterial blood volume venous blood volume Arterial pressure C: CVP Normal 8 Effect of moderate heart failure on equilibrium point 6 A Cardiac output, L/min C 4 B Heart failure 2 0 2 4 6 8 Central venous pressure, mm Hg The combination of decreased CO and increased CVP is a sign of heart failure Heart failure is the inability of the heart to pump blood sufficient to meet the metabolic demands of the body or to do so only with abnormally high filling pressures.
+ A: Cardiac output Arterial pressure Arterial blood volume CV Reflexes Retain NaCl & H2O blood volume venous blood volume B: CVP Severe heart failure Effect of severe heart failure The increase in blood volume shifts the vascular function curve upward. This increase is a compensation that ameliorates the decrease in CO.
10 Normal 8 6 Cardiac output, L/min C A 4 B 2 0 2 4 6 8 10 Central venous pressure, mm Hg AB represents the decrease in CO due to myocardial failure BC represents the increase in CVP due to the increase in total blood volume & the compensatory increase in CO (Frank - Starling mechanism) Effect of severe heart failure Severe heart failure
Left ventricular failure CO Left atrial pressure Pulmonary venous, capillary, arterial pressure Pulmonary capillary pressure Pulmonary edema afterload to Rt. ventricle dyspnea Rt. Ventricular failure Systemic venous pressure Venous pressure in heart failure Dependent edema In right heart failure superficial neck veins are distended & venous pressure waves may be visible.
Blood volume Venomotor tone Muscle pump Respiratory pump Active relaxation (SERCA) Passive relaxation Venous return Contractility (Sympathetic activity) Afterload Ventricular compliance Filling time (heart rate) Preload End diastolic ventricular volume End systolic volume ANS Cardiac output = stroke volume x heart rate Cardiac output & vascular function SERCA = sarcoplasmic reticulum Ca++ ATPase ANS = autonomic nervous system
Left ventricular failure ANP & BNP inhibit the renin angiotensin system & decrease afterload (total peripheral resistance) renin secretion from kidney formation of angiotensin II CO TPR (afterload) Left atrial pressure (preload) secretion of ANP from atria cardiac work secretion of BNP from ventricles stroke volume Positive feedback CO Increasing plasma BNP concentration is a sign of worsening heart failure. The kidneys become insensitive to natriuretic peptides in heart failure so renin secretion from the kidneys continues despite increased plasma ANP & BNP. Consequently the beneficial effect on decreasing afterload is limited.