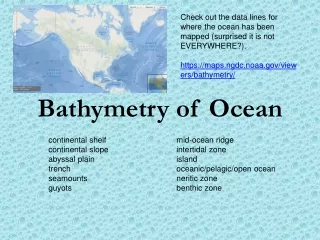
Download
1 / 24
240 likes | 352 Views
Explore error budgets in vertical positioning using traditional and RTK GPS hydrography methods in various marine environments. Key topics include soundings, draft measurements, tides, and operational scenarios.

E N D
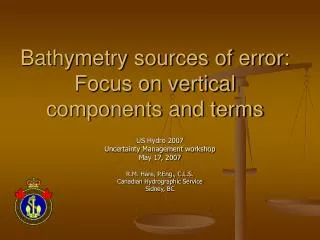
Bathymetry sources of error: Focus on vertical components and terms US Hydro 2007 Uncertainty Management workshop May 17, 2007 R.M. Hare, P.Eng., C.L.S. Canadian Hydrographic Service Sidney, BC
Objectives • To examine vertical (random) error budgets for traditional and RTK GPS hydrography in different areas • To provide some insight into the requirements for RTK GPS through an examination of operational scenarios
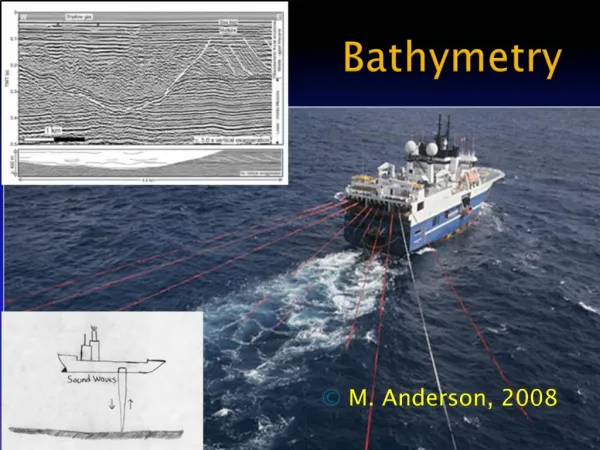
Vertical positioning • Ship and launch sounding • Estuarine/Riverine (very shallow, 5-20 m, EM3000) • Coastal (shallow, 8-100 m, EM3000) • Offshore (medium, 80-1000 m, EM1002) • Oceanic (deep, 800 m – F.O.D., EM121A) • Airborne (lidar) sounding (1-50 m) • Lidar topography • Drying heights & elevations • Wave heights/tides from buoys • Establishment/recovery of vertical datum
Dynamic draft Tide, WL θ r Chart datum Measured Depth, d Charted Depth, D Traditional sounding reduction • D = d + draft – WL • d = r cos (θ+R) cos P • r = range • Θ = beam angle • R = Roll angle • P = Pitch angle
Soundings Measurement Refraction Attitude Heave Measurement Induced by R&P Dynamic draft Static draft Squat Load changes Buoyancy changes Tides/water levels Measurement Filtering Spatial prediction Time synchronization Sounding error budgets - traditional
GPS RTK, Z Ellipsoid Antenna Height, A Separation Model, M Dynamic draft Tide, WL θ r Chart datum Measured Depth, d Charted Depth, D RTK GPS sounding reduction • D = d + A – Z – M • A = Δx sinP • + Δy cosP sinR • + Δz cosP cosR
Sounding error budgets – RTK GPS • Soundings • Measurement • Refraction • Attitude • RTK GPS elevation • Antenna height • Lever arm • Roll and Pitch • Separation model • Chart-datum – Ellipsoid
Operational Scenarios • Canada’s West Coast • Osborne Seamount • Nitinat Canyon • Fraser River • Patricia Bay (IOS)
11.58 14.98 15.52 Datum Separation values 17.53 16.46 17.77 17.65 GPS Benchmarks 16.99 21.47 19.64 19.74 20.78 20.34 Permanent Water Level Network 07120 Victoria 07277 Patricia Bay 07654 New Westminster 07735 Vancouver 07795 Pt Atkinson 08074 Campbell River 08408 Port Hardy 08545 Bamfield 08615 Tofino 08735 Winter Harbour 08976 Bella Bella 09354 Prince Rupert 09850 Queen Charlotte City
Assumptions - GPS • Coastal and Estuarine or Riverine (0 – 10 km): local RTK GPS • Vertical accuracy: +/- 0.02 m (68%)1 • Offshore (10 – 40 km): Long-range kinematic (LRK) • Vertical accuracy: +/- 0.06 m (68%)2 • Oceanic (> 40 km): Global system, e.g. C-Nav (RTG) • Vertical accuracy: +/- 0.18 m (68%)3 • All values for real-time at highest data rate • G. Lachapelle, Personal communication, 2004 • Thales Navigation Aquarius LRK specifications at 20Hz, 40 km • C&C Technologies DGPS-PI-001.1 Static accuracy of C-Nav RTG V13.1
Other assumptions • Offshore and Oceanic surveys • Done by ship • Larger lever arm • Greater draft uncertainty • More stable sound speed structure • No local tide gauge • Oceanographic phenomena • Estuarine and Riverine surveys • Done by launch • Draft uncertainty from buoyancy changes • Possible salt wedges • Sloping or stepped chart datum
Sea surface height maps showing the Haida and Sitka Eddies • Sea surface elevations measured by TOPEX/Poseidon and ERS-2 satellite altimeters. • Red regions denote high sea surface • Blue regions denote depressions. • Annotations by Ocean Science and Productivity Division, DFO Science
Comparison of Traditional and GPS RTK depth error budgets(outer beams) – depth error (m)
Comparison of Traditional and GPS RTK depth error budgets(outer beams) - % of depth
Observations • RTK GPS provides greater incremental improvement in shallow-water and for near-nadir beams • Sounder system errors tend to dominate - variable error contribution
Conclusions • RTK GPS does not appear to provide huge benefits over traditional methods in terms of reducing total sounding error • Benefits may come from operational efficiencies • No tide gauge installation • No need to measure dynamic draft • Possible heave estimation/reduction from higher data rate RTK elevations
Remaining questions • Can we expect significant improvement from post-mission GPS? • Can/will GPS replace VRU for heave compensation? • How can we quantify real separation model errors?
Caveats • This was only a look at random error contributions • Better have an uncertainty management plan to deal with: • systematic errors; • time-delay motion artefacts; and • removal of accidental errors