Extending the Loop Design for Microarray Experiments
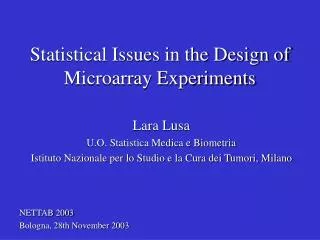
Extending the Loop Design for Microarray Experiments. Naomi S. Altman, Pennsylvania State University), naomi@stat.psu.edu Interface Meetings May 04. Expt Design and Microarrays. Microarrays are Expensive Noisy A perfect situation for optimal design. Outline. Reference Design


Extending the Loop Design for Microarray Experiments
E N D
Presentation Transcript
Extending the Loop Design for Microarray Experiments Naomi S. Altman, Pennsylvania State University), naomi@stat.psu.edu Interface Meetings May 04
Expt Design and Microarrays • Microarrays are • Expensive • Noisy • A perfect situation for optimal design
Outline • Reference Design • Loop Designs • Replication • Optimal Design/Analysis • Incorporating Multiple Factors and Blocks
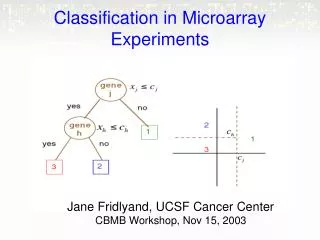
Arrow Notation Introduced by Kerr and Churchill (2001) Each array is represented by an arrow. Red Green
Reference Design A B Reference C 4 arrays 1 sample/treatment 4 reference samples D
Loop Design(Kerr and Churchill 2001) A B 4 arrays 2 samples/treatment D C
Replication Often there is confusion among: Biological replicates Technical replicates repeated samples split sample and relabel spot replication In this presentation: We consider only one spot/gene/array any technical replicates are averaged each sample is an independent biological replicate
Linear Mixed Model for Microarray Data • is the response of the gene in one channel • is the mean response of the gene over all treatments, channels, arrays • is the effect of treatment i • the effect of dye j • is the effect of the array k (or spot on the array) • is the random deviation from the other effects and includes biological variation, technical variation and random error
Linear Mixed Model for Microarray Data The 2 channels on a single spot are correlated → array should be treated as a random effect
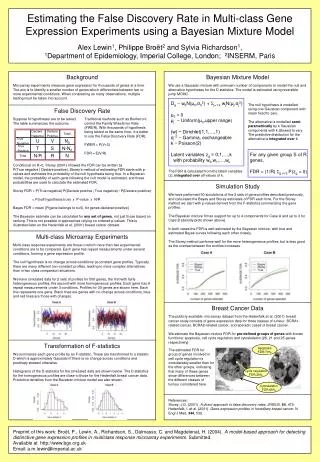
Differencing Channels on an Array Often the difference between samples on a single array is the unit of analysis: Normalization is almost always done on this quantity. In a reference design, the difference between treatments A and B can be estimated from 2 arrays by But there can be a large loss of information.
Drosophila arrays courtesy of Bryce MacIver, PSU Var(M)=0.126 Var(M)=0.453
Reference Design The reference sample is the same biological material on every array T treatments, k replicates, kT arrays If there are technical dye-swaps, these are averaged to form 1 replicate. If all comparisons are between treatments, there is no need to dye-swap. If there are dye-swaps, these should be balanced by treatment.
Reference Design – Usual Analysis Usually the analysis is done on D. E.g. Using the linear mixed model, we see that the variance of one pair is and with k replicates, the variance of the estimated difference is
Reference Design – Optimal Weights Consider using . Then The optimal w is The resulting variance for a single replicate is and with k replicates, the variance of the estimated difference is
Reference Design – Optimal Weights We do not know the optimal weights but if we use mixed model ANOVA such as those available in SAS, Splus or R, the weights are approximated from the data – leading to more efficient computations.
A B D C Loop Designs A loop is balanced for dye effects and has two replicates at each node. T treatments, 2k replicates, Tk arrays Recall: for a reference design we get only k replicates on Tk arrays
A B D C Loop Designs T=4, 4 arrays Using optimal weighting Var(A-B)=Var(A-D) = Var(A-C)= Both are smaller than the variance of the reference design with 4 arrays
A A A B C B D D C C B D Loop Designs T=4 Design L4C Design L4B Design L4D
T=4, 12 arrays Reference Design – 3 replicates/treatment Var(difference) = Loop Design – 3 loops = 6 replicates/treatments 3* L4C Var(A-B)= Var(A-C)= L4B+L4C+L4D Var(difference) =
T=4, 12 arraysAssuming Reference Design – 3 replicates/treatment Var(difference) = 0.83 Loop Design – 3 loops = 6 replicates/treatments 3* L4C Var(A-B)= 0.46 Var(A-C)= 0.58 L4B+L4C+L4D Var(difference) = 0.47
gT GT Gt gt Incorporating 2x2 Factorialin a Loop The design is 2 genotypes G,g and 2 tissuesT,t Only within genotype and within tissue comparisons are of interest
An 8 Treatment Example A B C H D G F E
An 8 Treatment Example A B C H 2 Complete Blocks D G F E
An 8 Treatment Example A B C H Replication: Yellow loop? Red “loop”? D G F E
And now for the rest of the story A B Missing arrays – not fatal but reduce efficiency Added treatments D C A B E C D
And now for the rest of the story A B Missing arrays – not fatal but reduce efficiency Added treatments D C A B E C D
The Moral of the Story • Loop designs are very efficient • Can incorporate factorial arrangements • Can incorporate blocks • Can be replicated in various ways to improve efficiency • Optimal design can help determine which (generalized) loop design to use • ANOVA-type analyses on the individual channels – not differencing – should be used for analysis.
C1 A1 B1 C2 A2 B2