Download
1 / 54
540 likes | 747 Views
Developing macroinvertebrate biological indicators of land use in Southern Ecuador. Carrie Anderson Team 2: Watershed Management of the Andean Paramo Ecology and Conservation Biology University of Idaho Supervising Faculty: Dr. Frank Wilhelm Department of Fish and Wildlife Resources

E N D
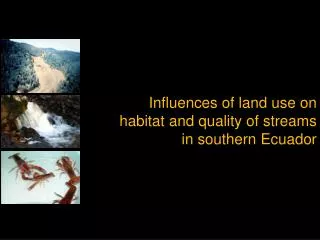
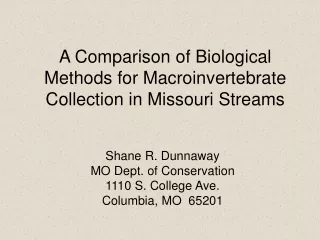
Developing macroinvertebrate biological indicators of land use in Southern Ecuador Carrie Anderson Team 2: Watershed Management of the Andean Paramo Ecology and Conservation Biology University of Idaho Supervising Faculty: Dr. Frank Wilhelm Department of Fish and Wildlife Resources University of Idaho Carlos Iñiguez A.Instituto de EcologíaUniversidad Técnica Particular de Loja
Overview • Background • Goals and Objectives • Site Description • Methods • Data Analysis • Support and Feasibility • Timeline http://tripwow.tripadvisor.com/slideshow-photo/18-panoramic-view-from-podocarpus-national-park-by-travelpod-member-thymeoff-vilcabamba-ecuador.html?sid=13359132&fid=tp-15
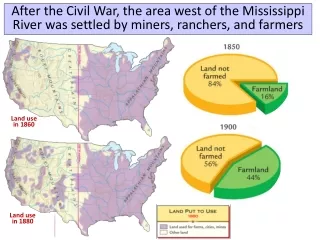
Introduction • Decline in surface water quality • Causes of decline • Pollution • Sedimentation • Acidification • Flow regulation • Impoundment • Land use change (USEPA 2011, Pimentel et al. 1997) http://pubs.usgs.gov/circ/circ1211/major_findings.htm http://blackwarriorriver.org/siltation-sedimentation.html http://jdurward.blogspot.com/2007_04_01_archive.html
Indicators of Stream Quality • Abiotic factors commonly assessed • Stream discharge • pH • Alkalinity • Electric Conductivity (EC) • Temperature • Dissolved Oxygen (DO) • Nutrient concentrations (Fleischbein et al. 2006, Bücker et al. 2010) Photo by Anderson (2010)
Indicators of Stream Quality • Biotic factors commonly assessed • Riparian and aquatic habitat assessment • Biological indicator frameworks (Bücker et al. 2010, USEPA 2011, Grafe et al. 2002) https://www.e-education.psu.edu/geosc10/book/export/html/1733
Biological Indicators • Predictable and consistent response • Tolerance varies • Occurrence / abundance correlated to changes in abiotic conditions (Bücker et al. 2010, Cain et al. 1992, Cairns et al. 1993) Photos by Fausto Fausto López
Biological Indicators http://tispaquin.blogspot.com/2010/05/severe-nutrient-loading-at-china-lake.html • Types of Indicators • Periphyton
Biological Indicators http://tispaquin.blogspot.com/2010/05/severe-nutrient-loading-at-china-lake.html • Types of Indicators • Periphyton • Macrophytes http://www.sweetwaterwekivasprings.com/component/content/article/87-July-August-2010/61-native-aquatic-plants-plant-a-rainbow-along-your-shoreline
Biological Indicators http://tispaquin.blogspot.com/2010/05/severe-nutrient-loading-at-china-lake.html • Types of Indicators • Periphyton • Macrophytes • Fish http://www.sweetwaterwekivasprings.com/component/content/article/87-July-August-2010/61-native-aquatic-plants-plant-a-rainbow-along-your-shoreline http://www.flickr.com/photos/87498048@N00/4188587349/
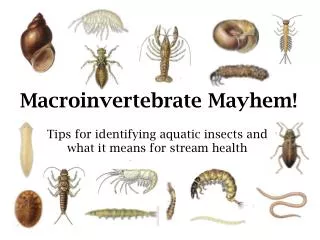
Biological Indicators http://tispaquin.blogspot.com/2010/05/severe-nutrient-loading-at-china-lake.html • Types of Indicators • Periphyton • Macrophytes • Fish • Benthic macroinvertebrates (Adams and Greeley 2000, USEPA 2011) http://www.sweetwaterwekivasprings.com/component/content/article/87-July-August-2010/61-native-aquatic-plants-plant-a-rainbow-along-your-shoreline http://www.flickr.com/photos/87498048@N00/4188587349/ http://www.cs.umb.edu/~fstours/
Biological Indices • Sensitive organisms organized into indices: Photo by FaustoLópez
Biological Indices • Sensitive organisms organized into indices: • Trend Biotic Index – TBI Photo by FaustoLópez
Biological Indices • Sensitive organisms organized into indices: • Trend Biotic Index – TBI • Family Biotic Index – FBI Photo by FaustoLópez
Biological Indices • Sensitive organisms organized into indices: • Trend Biotic Index – TBI • Family Biotic Index – FBI • Biological Monitoring Working Party – BMWP Photo by FaustoLópez
Biological Indices • Sensitive organisms organized into indices: • Trend Biotic Index – TBI • Family Biotic Index – FBI • Biological Monitoring Working Party – BMWP • EphemeropteraPlecopteraTrichoptera Index – EPT (Bücker et al. 2010, Grafe et al. 2002) Photo by FaustoLópez
EPT Index • Commonly used for stream quality assessment • Widely transferable • Evaluates number of distinct EPT taxa • Particularly sensitive to pollution • Changes in occurrence correlated with concentration of pollutants (USEPA 2002, Johnson et al. 1993) http://www.discoverlife.org/mp/20q?search=Perlodidae http://www.entomology.umn.edu/midge/VSMIVP%20Key/English/Hydropsychidae.htm http://www.cals.ncsu.edu/course/ent525/water/aquatic/pages/03_jpg.htm
Background • Indicator frameworks in developed countries • Implementation in developing countries? (Resh 1995, Bücker et al. 2010) http://tripwow.tripadvisor.com/slideshow-photo/18-panoramic-view-from-podocarpus-national-park-by-travelpod-member-thymeoff-vilcabamba-ecuador.html?sid=13359132&fid=tp-15
Background • Stream Quality in Ecuador • Focus on high elevation stream networks • Importance to the local people • Headwaters in the Paramo Ecosystem (Bücker et al. 2010, Buytaert et al. 2006) http://valleyoflongevity.com/
Background • Stream Quality in Ecuador • Focus on high elevation stream networks • Importance to the local people • Headwaters in the Paramo Ecosystem (Bücker et al. 2010, Buytaert et al. 2006) http://valleyoflongevity.com/
Background • Stream Quality in Ecuador • Focus on high elevation stream networks • Importance to the local people • Headwaters in the Paramo Ecosystem (Bücker et al. 2010, Buytaert et al. 2006) http://valleyoflongevity.com/
Background • Need for stream quality monitoring methods • Bioindicator framework in Ecuador lacking (Bücker et al. 2010) Photo by Fausto López
Objectives • Goal: To contribute to the assessment of stream quality for high elevation systems of southern Ecuador
Objectives • Goal: To contribute to the assessment of stream quality for high elevation systems of southern Ecuador • Objectives: • Relate biotic and abiotic parameters and connect this relationship to land-use and catchment characteristics
Objectives • Goal: To contribute to the assessment of stream quality for high elevation systems of southern Ecuador • Objectives: • Relate biotic and abiotic parameters and connect this relationship to land-use and catchment characteristics • Determine if a group of aquatic invertebrates exist that are indicative of land use and differences in stream habitat and water quality
Objectives • Goal: To contribute to the assessment of stream quality for high elevation systems of southern Ecuador • Objectives: • Relate biotic and abiotic parameters and connect this relationship to land-use and catchment characteristics • Determine if a group of aquatic invertebrates exist that are indicative of land use and differences in stream habitat and water quality • Examine if a bioindicator approach is applicable in the Ecuadorian Andes using end member systems along a disturbance gradient
Hypotheses • H0 1 : • There is no relationship between macroinvertebrates and land use in high elevation montane tropical streams in the Andes Mountains of southern Ecuador
Hypotheses • H0 1 : • There is no relationship between macroinvertebrates and land use in high elevation montane tropical streams in the Andes Mountains of southern Ecuador • H0 2: • No difference in macroinvertebrate taxa occurrence, richness, evenness, and diversity between disturbed and undisturbed
Hypotheses • H0 1 : • There is no relationship between macroinvertebrates and land use in high elevation montane tropical streams in the Andes Mountains of southern Ecuador • H0 2: • No difference in macroinvertebrate taxa occurrence, richness, evenness, and diversity between disturbed and undisturbed • H0 3: • No difference in abundance of EPT taxa between disturbed and undisturbed sites
Site Description http://www.compassion.com/sponsordonor/projectslideshows/ecuadorprojecturban.htm http://checkpointzero.com/blog/2010/02/11/where-the-hecuador-is-ecuador-anyway/
Pilot Study • i) Optimize sampling time per sample • ii) Determine number of samples given between-sample variance Photo by FaustoLópez
Pilot Study • i) Optimize sampling time • Triplicate samples for 15 sec, 30 sec, 1 min, 2 min • Total abundance determined in the field (Krebbs 1999, Gordon et al. 1992) http://www.idoldesigners.com/
16 14 12 10 Cumulative variance 8 6 4 2 0 0 10 20 30 Number of samples Pilot Study • ii) Number of Samples per reach • Cumulative variance plotted versus number of samples (Krebb 1999, London and Gertz 1994)
Field Methods • Optimal design • At least 2 catchments • Impact • Control • 4 reaches sampled Control Impact
Field Methods • Reach Characteristics • Width • Depth • Velocity • Discharge (Hauer and Lamberti 1996) Photo by Carlos Iñiguez A.
Field Methods • Abiotic Characteristics • Temperature • pH • Dissolved Oxygen (DO) (Hauer and Lamberti 1996) • Sampled using a YSI 556 Multiprobe http://www.instrumart.com/products/31754/ysi-556-multiparameter-system
Sampling Methods • Hess sampler or D-Net • Quantitative known area • Sample time determined in Pilot Study (Hauer and Lamberti 1996) Photo by Carlos Iñiguez A. http://www.benmeadows.com/D-Frame-Aquatic-Dip-Net_s_224916/Nets_31224961/?isredirect=true http://new.freshwaterlife.org/how-to-sample
Sampling Methods • Number of samples per stream reach • Randomized Sampling Method • Preserve samples in field using 70% ethanol • Return to laboratory setting for sample analysis (Hauer and Lamberti 1996, Grafe et al. 2002)
Laboratory Methods • Randomized subsample from each field sample • Classify to lowest taxonomic level • Transport unprocessed samples back to US for further analysis • Permits acquired in Ecuador (Hauer and Lamberti 1996, Grafe et al. 2002, Gordon 1992) Photo by Carlos Iñiguez A. http://www.montegraphia.com/?m=200907&paged=3
Data Analysis Biological Indices • Abundance
Data Analysis Biological Indices • Abundance • Richness
Data Analysis Biological Indices • Abundance • Richness • % EPT %EPT = (E + P + T) x 100 total abundance
Data Analysis Biological Indices • Abundance • Richness • % EPT • Diversity • Shannon – Wiener Index %EPT = (E + P + T) x 100 total abundance Shannon – Wiener Index H’ = - Σpi log pi
Data Analysis Biological Indices • Abundance • Richness • % EPT • Diversity • Shannon – Wiener Index • Evenness • Simpson Index (Krebs 1999, Hauer and Lamberti 1996, Brooks et al. 2003) %EPT = (E + P + T) x 100 total abundance Shannon – Wiener Index H’ = - Σpi log pi Simpson Index C = Σipi2
Data Analysis Statistical Analysis • Basic descriptive statistics • Mean • Standard Deviation • Variance (Gordon 1992, London and Gertz 1984) Photo by FaustoLópez Photo by FaustoLópez http://tripwow.tripadvisor.com/slideshow-photo/18-panoramic-view-from-podocarpus-national-park-by-travelpod-member-thymeoff-vilcabamba-ecuador.html?sid=13359132&fid=tp-15
Data Analysis Statistical Analysis • Basic descriptive statistics • Mean • Standard Deviation • Variance (Gordon 1992, London and Gertz 1984) Photo by FaustoLópez • Inferential Statistics • ANOVA • Regression • Correlation • (Gordon 1992, London and Gertz 1984, O’Brien 1979) Photo by FaustoLópez http://tripwow.tripadvisor.com/slideshow-photo/18-panoramic-view-from-podocarpus-national-park-by-travelpod-member-thymeoff-vilcabamba-ecuador.html?sid=13359132&fid=tp-15
Data Analysis Statistical Analysis • Basic descriptive statistics • Mean • Standard Deviation • Variance (Gordon 1992, London and Gertz 1984) Photo by FaustoLópez • Inferential Statistics • ANOVA • Regression • Correlation • (Gordon 1992, London and Gertz 1984, O’Brien 1979) Photo by FaustoLópez • Multivariate Statistics • Canonical Correspondence Analysis (CCA) • (Bücker et al. 2010, Braak and Verdonschot, 1995) http://tripwow.tripadvisor.com/slideshow-photo/18-panoramic-view-from-podocarpus-national-park-by-travelpod-member-thymeoff-vilcabamba-ecuador.html?sid=13359132&fid=tp-15
Support and Feasibility • Grant Provided by the National Science Foundation (NSF) • Dr. Frank Wilhelm • University of Idaho • Carlos Iniguez A. • Doctoral Candidate at UTPL • Adrian Leiva • Carlos’ associate/ invertebrate taxonomist
Project 1: Cultural perspectives on high Andean watersheds Amy Forsgren Project 3: Evaluating the jurisdictional map of authority over watershed decisions Danie Merriman Ecuador Summer Research Program University of Idaho Universidad Tecnica Particular de Loja Team 2: Watershed management of the Andean páramo Project 4: Evaluating the physical impact of land use Emily Shimada Project 5:Evaluating the biotic impacts of land use Carrie Anderson