Download
1 / 13
130 likes | 272 Views
Greenhouse Gas Inventory 2008 Update. Methodology. Utilized Clean-Air Cool-Planet software - ( www.cleanair-coolplanet.org/ ) Goals of the inventory - Update Duke’s 2004 GHG inventory Characterize the major sources and examine trends in emissions over the last 18 years

E N D
Greenhouse Gas Inventory2008 Update Greenhouse Gas Inventory - Duke University
Methodology • Utilized Clean-Air Cool-Planet software - (www.cleanair-coolplanet.org/) • Goals of the inventory - • Update Duke’s 2004 GHG inventory • Characterize the major sources and examine trends in emissions over the last 18 years • Provide the baseline for Duke’s overall Climate Commitment Action Plan • Boundaries of the inventory - • “Duke proper” – University and Health System buildings on and adjacent to the Durham campus and the Marine Lab. • Did not include leased space or satellite health system buildings and hospitals Greenhouse Gas Inventory - Duke University
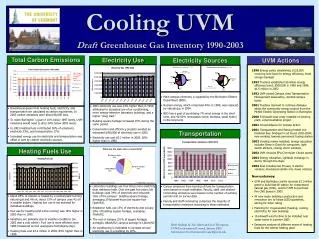
Transportation Fleet fuel Gasoline University BP gas cards FMD purchases DUPD purchases West Campus grounds gasoline purchases Diesel Gallons sold at Transit fueling station Employee Air travel Used Duke American airlines data for FY0506, 0607 to get an average price per mile Took Employee Travel and Reimbursement financial data on air travel purchases / avg. price per mile Commuters Used 2006 and 2008 TTA survey data for mode share info Used a straight-line analysis of employee address data to estimate an average daily commute distance Sources of GHG Emissions Inventoried Greenhouse Gas Inventory - Duke University
Transportation Employee Air travel Not included in 2004 Inventory because of a lack of data As part of the Climate Commitment we are required to include this Commuters Used actual 2006 and 2008 TTA survey data for mode share info – 2004 numbers were estimated Durham Regional and Duke Raleigh employees were not included in the employee commute distances – may explain some of the reduction, 15 miles to 9.1 miles Changes in 2008 Inventory Greenhouse Gas Inventory - Duke University
Electricity Duke Power consumption Used 5 main Duke accounts, counts for 95% of the electricity usage Included Marine Lab On-Campus Stationary Steam Plant fuel Coal Natural Gas #2 Fuel Oil Sources of GHG Emissions Inventoried Greenhouse Gas Inventory - Duke University
Electricity Duke Power consumption Updated emissions factors for specific Duke Energy data back to 1990 2004 inventory used regional average from the Southeastern Electric Reliability Council (SERC). On Campus Stationary Steam Plant fuel Duke uses a combination of recycled #2 fuel oil and regular #2 fuel oil, emission factors are the same – didn’t separate out Previous inventory didn’t have emissions factors tied to the usage of recycled #2 oil, under-reporting impact Changes in 2008 Inventory Greenhouse Gas Inventory - Duke University
Refrigerants Estimated from FMD and E&O purchasing data minus current inventory Solid Waste Landfilled solid waste Incinerated medical waste Fertilizer Usage data from FMD, Washington Duke Inn, Athletics and Duke Gardens Nitrogen content averaged across all four sources Offsets Duke Forest preservation Sequestration potential hasn’t changed since 2004, forest management and size has stayed the same Composting REC purchases Sources of GHG Emissions Inventoried Greenhouse Gas Inventory - Duke University
Fertilizer Not included in previous inventory Square Footage 2004 numbers from Plant Accounting were not consistently gross square feet Updated numbers back to 1990 with new gross square feet to maintain consistency Changes in 2008 Inventory Greenhouse Gas Inventory - Duke University
Questions? Greenhouse Gas Inventory - Duke University
15% increase since 2004 2004 levels = 377,489 2005 levels = 416,951 2006 levels = 444,002 2007 levels = 433,961 + 10.5%+ 6.5%- 2.3% Greenhouse Gas Inventory - Duke University
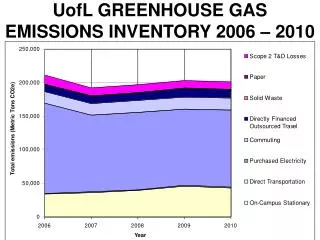
Emissions by Scope 2006-2007 Transportation 23% Steam Plant 24% Purchased Electricity 53% Greenhouse Gas Inventory - Duke University
2004 = 30.0 2005 = 31.3 2006 = 32 2007 = 31.2 Greenhouse Gas Inventory - Duke University
Total Mt eCO2 vs. Net Mt eCO2 Greenhouse Gas Inventory - Duke University