Download

1 / 16
160 likes | 423 Views
Chapter 13/17 Measuring the Economy’s Performance. • Inflation - prolonged rise in the general price level of goods and services which threatens the economy and makes measuring the economy difficult. • E conomic indicators - statistics that help economists judge the health of an economy.

E N D
Chapter 13/17 Measuring the Economy’s Performance
• Inflation- prolonged rise in the general price level of goods and services which threatens the economy and makes measuring the economy difficult. • Economic indicators- statistics that help economists judge the health of an economy. • Gross domestic product (GDP)- the market value of all final goods and services produced in a country during a given period of time. • Unemployment rate- the percentage of the labor force that is not employed but is actively seeking work. • Inflation rate- the percentage increase in the average price level of goods and services from one month or year to the next. • Consumer price index (CPI)- a measure of price changes in consumer goods and services. The CPI shows changes in the cost of living over time.
Business cycle- a recurring pattern of growth and decline in economic activity over time. • Recession- a period of declining national activity, usually measured as a decrease in GDP for at least two consecutive quarters (six months). • GDP- the market value of all final goods and services produced in a country during a given period of time. • Market Value- the price buyers are willing to pay for a good or service in a competitive marketplace. • Final goods- any new good that is ready for use by a consumer. • Intermediate goods-goods that are used in the production of final goods, • example: grains used to produce cereal or steel and • rubber used to manufacture cars. These are not included in GDP.
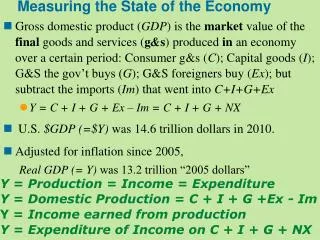
Gross Domestic Product- the market value of all final goods and services produced in a country during a given period of time. Nominal GDP- measures the output of an economy valued at today’s prices or in current dollars. Real GDP- measures the output of an economy in constant dollars. Constant dollars is a fixed rate that was current in a specific base year. Per capita GDP- is a nations’ real gross domestic product divided by its population. (It’s an accepted measure of a society’s standard of living.) C+I+G+NX=GDP
C+I+G+NX=GDP C= Household Consumption- goods and services bought by people in households for personal use. It ranges from food and fuel to movie tickets and medical care. I= Business Investment- business invest in capital goods such as buildings and machinery. It also includes goods produced but not yet sold. G= Government Purchases- Federal, state and local governments purchases of goods and services. NX= Net exports- this is the value of all exports minus all imports. Economists only measure final products so that things are not counted twice. For example, when calculated revenue from bread, they do not consider the wheat that bread producers bought from wheat farmers. Economists do not count used items, because they have already been counted. If you buy a I-phone off Ebay for $100 that sale is not computed, because the original owner’s purchase was already counted.
Weakness of GDP GDP leaves out unpaid household and volunteer work. GDP ignores informal and illegal exchanges. (babysitters, barter). GDP counts some negatives as positive. (hurricane can generate rebuilding and economic activity but people are still far worse off than they would have been if disaster didn’t strike. GDP ignores negative externalities. (a rapidly industrializing country may have a rising GDP but they are polluting air and water). GDP places no value on leisure time. GDP says nothing about income distribution.
Employed-members of the labor force who have jobs. Unemployed- members of the labor force who are jobless but looking for work. Frictional unemployment- when a person seeks to enter the workforce or quits one job to seek another. Structural unemployment- when advances in technology eliminate jobs. Seasonal unemployment- when businesses shut down or slow down for part of the year. Cyclical unemployment- when there is a decline in business activity during an economic downturn. Discouraged workers- people who have given up looking for work. Involuntary part-time workers- those people unable to find full-time work and settle for part-time jobs.
Number unemployed Unemployment rate= % = _____________ X 100 Number in labor force -------------------------------------------------- In 2010 the unemployment rate was 9.6% = 14.8 million persons X 100 153.9 million persons
The Consumer Price Index (CPI)- an indicator used to track changes in the prices of basic household goods and services. Market Basket- representative group of goods and services used to compile the CPI. Examples: food, housing, transportation, apparel, education, recreation, medical care and personal care. Every 10 years the basket is updated with new items. Each group of items in the CPI’s market basket is given a “weight,” or percentage, that reflects how much consumers spend on it. Average consumers spend the largest part of their income on housing, which includes rent or mortgage payments, property taxes, heat, electricity, and furniture.
Adjusting for Inflation Nominal Cost of Living- the price a person pays for a pair of shoes or any other product. It’s its cost in current dollars. Real Cost of Living-the nominal cost of basic goods and services adjusted for inflation. Creeping Inflation- in the U.S. we have to expect a certain amount of gradual inflation every year. Since 1914 the average rate of inflation has been about 3.4%. Hyperinflation-runaway inflation. (50% or higher). No one can predict how high price will go and people lose confidence in their currency. U.S.- 10% in late 1970’s Germany after WWI-300% per month Russia- 874% between 1993-2004 Deflation- when prices go down over time. Good for consumers, bad for businesses.
Economic Indicators- Statistics that measure variables in the economy. Leading indicators-economic factors that change before the economy starts to follow a particular pattern or trend. They are used to predict changes in the economy, but are not always accurate. Examples: 1. Average weekly hours for workers in manufacturing. 2. Weekly initial claims for unemployment insurance. 3. New orders for consumer goods. 4. Speed with which companies make deliveries. 5. Numbers of contracts and orders for factories and equipment. 6. Number of building permits issued for private housing. 7. Changes in the money supply in circulation. 8. Stock prices. 9. Changes in interest rates. 10.Changes in consumer expectation.
Coincident indicators- an economic factor that provides information on the current state of the economy. It does not show which way the economy is heading, but where it is at. Examples: 1. Number of nonagricultural workers who are employed. 2. Personal income minus transfer payments. 3. Rate of industrial production. 4. Sales of manufacturers, wholesalers and retailers.
Lagging Indicators- economic factors that tend to change • only after an economy has already changed, or has begun to • follow a particular pattern or trend. Examples: • Average length of employment. • Size of manufacturing and trade inventories. • Labor cost per unit of output in manufacturing. • Average interest rate charged by banks to their best • customers. • Number of commercial and industrial loans to be repaid. • Ratio of consumer debt (credit cards) to personal income. • Changes in the CPI for services.
The Business Cycle- a recurring pattern of change as an economy expands and contracts. Expansion- economic activity generally increases from month to month. Peak- the point at which expansion ends. At the peak economic activity has reached its highest level. Contraction- a period of general economic decline marked by a falling GDP and rising unemployment. Trough- the lowest pint of a contraction. Once the economy hits the bottom, a new expansion begins.