Download
1 / 5
60 likes | 195 Views
The Distributional Effects of Medical Advances. No clear predictions from economic theory The effects depend on: 1. Prevalence of the health problem(s) 2. Complexity and cost of the advance 3. Access to the advance (insurance, etc)

E N D
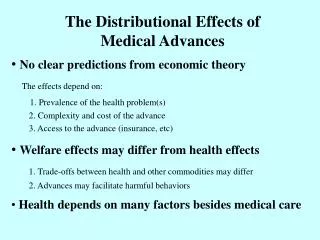
The Distributional Effects of Medical Advances No clear predictions from economic theory The effects depend on: 1. Prevalence of the health problem(s) 2. Complexity and cost of the advance 3. Access to the advance (insurance, etc) Welfare effects may differ from health effects 1. Trade-offs between health and other commodities may differ 2. Advances may facilitate harmful behaviors Health depends on many factors besides medical care
Year-to -Year Change of Age-adjusted Death Rates, U.S. Whites and Blacks, 1950-97(5 year moving average centered on middle year) Deaths per 100,000
Year-to -Year Percentage Change of Age-adjusted Death Rates, U.S. Whites and Blacks, 1950-97(5 year moving average centered on middle year) Percent per annum
Standard Deviation Across 50 U.S. States of Log of Age-adjusted Death Rate, 1979-2000 Standard deviation 0
OLS Regression Results Across 50 States Dependent Variable: Rate of decline of Age-adjusted mortality 1980-99, percent per annum (sign reversed) Mean 0.737 St.Dev. 0.164 RHS Variables Regression (Standard P Value CoefficientError) % in poverty (a -0.0272 (0.0079) 0.0013 % black (a -0.0025 (0.0028) 0.3765 % >=65 (a -0.0187 (0.0111) 0.1007 % foreign born (a 0.0249 (0.0054) <0.0001 Constant 1.1901 (0.1616) <0.0001 R2 =0.564 Adj. R2 = 0.525 a)Mean of 1980,1990 and 2000