Analyzing Relative Abundance in Mass Spectrometry Data
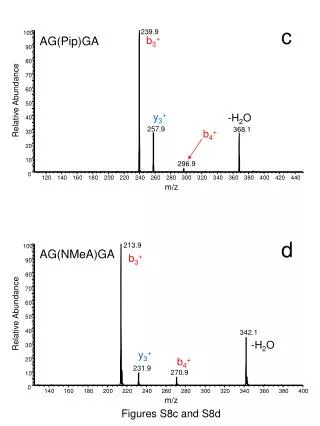
This study focuses on the relative abundance of various ions identified in mass spectrometry with specific m/z values. The measurement includes a detailed look into ions AG(Pip)GA and AG(NMeA)GA, along with their fragmentation patterns such as b3+, y3+, and associated losses of water molecules. Figures S8c and S8d provide visual representations of the data, presenting insights into the distinct ion behaviors and their relative abundances. This analysis is crucial for understanding molecular structure and behavior in chemical reactions.

Analyzing Relative Abundance in Mass Spectrometry Data
E N D
Presentation Transcript
239.9 100 90 80 70 60 Relative Abundance 50 40 257.9 368.1 30 20 10 296.9 0 120 140 160 180 200 220 240 260 280 300 320 340 360 380 400 420 440 m/z 213.9 100 90 80 70 60 Relative Abundance 50 40 342.1 30 20 231.9 270.9 10 0 140 160 180 200 220 240 260 280 300 320 340 360 380 400 m/z c AG(Pip)GA b3+ y3+ -H2O b4+ AG(NMeA)GA b3+ d -H2O y3+ b4+ Figures S8c and S8d