Understanding Aggregate Demand and Economic Fluctuations
Learn about the impact of changes in demand on output, consumption, investment, government spending, and net exports. Explore how factors like income, wealth, expectations, and taxes influence economic equilibrium. Dive into the complexities of the aggregate demand curve and its interaction with the price level in macroeconomics.

Understanding Aggregate Demand and Economic Fluctuations
E N D
Presentation Transcript
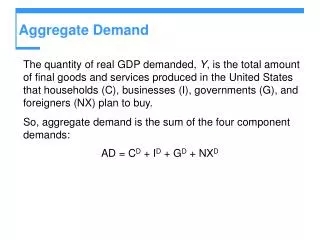
Up to this point we have mentioned that the short term fluctuations of RGDP around its potential is caused by changes in planned aggregate expenditure. Our first basic point of the theory is that changes in demand lead to changes in output made and input usage. Prices changes do not happen right away because firms just “meet the demand.” Let’s review this before we move on. AE is made up of C, I, G and X plans made by the various sectors On the next slide we see the economy at an equilibrium point where the AE line crosses the 45 degree line.
AE 450 AE1 RGDP Y1
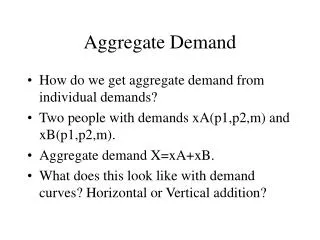
Consumption review Now let’s look at each part of AE. C = C(RGDP, W, expc, r, HD, taxesc). This means C is a function of income (RGDP), wealth, consumer expectations, the interest rate, household debt, and taxes. We have talked about the C-Y relationship. As Y, or RGDP, changes we move along the curve. The greater the wealth, w, the greater will consumption be. expc, or consumer expectations about the future, has an influence on C. The more confident about the future consumers are, the more will consumption spending be now. The interest rate, r, affects some consumption. When we buy cars and other items on interest we want less the higher the rate because we have to pay back that much more.
Consumption review The higher the level of household debt, HD, the lower the capacity to take on more debt and thus consumption will be lower. If taxesc (= taxes on households) rise then consumption will fall. (The reverse of each factor follows the same basic pattern.)
Investment review I = I(amo, bt, tc, stock, expb, r), where I = investment plans, amo = Acquisition, maintenance, and operating costs, bt = Business taxes, tc = technological change, stock= stock of capital goods on hand, expb = expectations business have about the future, and r = the interest rate. If amo goes up I goes down. If bt goes up I goes down. If tc goes up I goes up. If stock goes up I goes down. The higher the business expectation about the future the more investment will be today. A higher interest rate means it is more costly to invest, so less will happen.
Government Spending and Net Exports G = G(politics), so government spending is largely determined in the political arena. X = X(for) where X = net exports and for = the health of foreign economies. If foreign economies get better then X rises. Autonomous changes: You will note in the graph on slide 3 that if RGDP changes we move along the AE line and this works through the consumption component. But, if W, expc, r, HD, taxesc, amo, bt, tc, stock, expb, politics, or for should change we shift the AE line and a new level of RGDP results. Thus autonomous changes shift the AE line.
As an example, if the government imposes a greater level of taxes on households the AE line will shift down and RGDP will fall. The logic on the RGDP fall goes something like the following (which we saw before.) As households are taxed more they decide to spend less today. As their consumption falls, businesses see inventories build up and thus call on less production because they already can not sell all they have. As the production falls the economy then settles down again at a lower level of income where the spending by the sectors matches what is being made. We see this graphically on the next slide.
AE 450 AE1 AE2(higher taxes) RGDP Y2 Y1
Remember, up until now we have assumed prices are stable. But this is not part of the real world. So, we now have to make our model more complex to model the real world. We will start by allowing the price level to change. More specifically, we will incorporate the inflation rate into our model and we will add another graph. We still have the 45 degree line, AE graph, but we work with a new graph. On the next slide you see two graphs – the AE line graph and the new graph. In the new graph we will eventually have aggregate supply and aggregate demand. The new graph has RGDP on the horizontal axis and the price level of the vertical axis. Note, in my notes for ease of typing I will denote the price level as p.
PAE 45 degree AE1 RGDP Y1 p This is one point of the AD curve p1 RGDP Y1
The new graph we add to our tool bag is called the aggregate demand (AD) curve. We have all the information we need to make the graph. The graph is a summary of many ideas we have so far. In the AD curve graph we will have 1) RGDP on the horizontal axis, 2) The price level on the vertical axis. The way to look at the graph that follows: given a price level and all the items that influence AE will result in a level of RGDP that corresponds to the level of RGDP where the AE line crosses the 45 degree line.
Now, on the next screen I will add another point on the AD curve and this will happen by imagining that the price level rises (we do not have a theory about why it will rise yet, but just say it rises, OK, OK!) I want to first look at this from a mechanical point of view and then add the economic details. The higher price level will make C, I and X fall and thus the AE line will fall. So income and thus the RGDP will fall and we have another point in out new graph as seen on the next screen.
AE 45 degree AE1 AE2 RGDP Y2 Y1 p The AD curve p2 p1 RGDP Y1
Downward slope of AD curve Downward slope of the AD curve The downward sloping nature of the AD curve is a reflection of the idea that as the price level rises the AE line shifts down and RGDP falls. Now we want to give this idea economic meaning. There are 3 reasons for the AE line to shift down in this scenario and thus give us a downward sloping AD curve. 1) Real balance or real wealth effect – as the price level rises the purchasing power of people’s money declines. This may cause households to reduce C and save a bit so they can afford essentials in the future.
Downward slope of AD curve 2) Interest rate effect – (we see this idea more later) as the price level rises you and I demand more money (the gallon of milk we buy for 2.00 goes up to, say about two fifty, and so we need more money to make our transactions). With a given money supply and higher money demand makes the interest rate rise and thus consumption and investment fall. 3) Foreign purchases effect – as the price level domestically rises (assuming the rate does not change in other countries), if becomes increasingly difficult for foreigners to buy our goods and thus net exports fall.
Shift AD curve What things make the AE line shift? We said before if W, expc, r, HD, taxesc, amo, bt, tc, stock, expb, politics, or for should change we shift the AE line and a new level of RGDP results. Thus autonomous changes shift the AE line. Then we added the price level changing can change the AE line. All the things that make the AE line shift will make the AD line shift as well, EXCEPT for changes in the price level. Price level changes shift the AE line but have use move along an AD curve. Except for a change in the price level, if the AE line shifts up the AD curve shifts to the right and if the AE line shifts down the AD curve shifts left.
AE 45 degree example: say expc falls. AE1 lower spending because expc falls Then the AE line falls and the AD shifts to the left RGDP Y1 p p1 AD1 RGDP AD2 Y2 Y1