Download

1 / 36
400 likes | 725 Views
Quality management: SPC III – control charts for attributes . Presented by: Dr. Husam Arman. Control charts for attributes . Control charts for nonconforming (defective): p (percentage of defective units) np (number of defective units)

E N D
Quality management: SPC III – control charts for attributes Presented by: Dr. Husam Arman
Control charts for attributes • Control charts for nonconforming (defective): • p (percentage of defective units) • np (number of defective units) • Control charts for nonconformities (defects): • c (number of defects per sample) u (number of defects per unit)
Control charts for attributes • Many quality characteristics are not measured on a continuous scale or even a quantitative scale. • In these cases, we may judge each unit of product as either conforming or nonconforming (defective) - on the basis of whether or not it possesses certain attributes. • In general charts for attributes are less expensive than charts for variables, because measurements are less complex to be performed.
Control charts for attributes • However, attributes charts are generally not as informative as variables charts because there is typically more information in a numerical measurement than in merely classifying a unit as conforming or nonconforming. • For that reason sample size is typically larger than for variable charts (at least n=10)
Control charts for attributes • “Defect”: nonconformity that is serious enough to significantly affect the safe or effective use of the product • “Defective”: product unit with one or more defects.
Control charts for attributes • We will see the following charts for attributes: • (p) control chart for fraction nonconforming • Defectives • (np) control chart for number nonconforming • (u) control charts for nonconformities per unit • Defects (for every unit of product we count defects on it) • (c) control charts for nonconformities
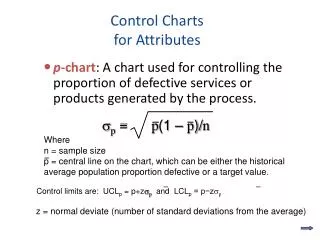
p-CHARTS (Control Charts for Fraction Nonconforming) • The fraction nonconforming (p) is defined as the ratio of the number of defective items in a population to the total number of items in that population:
p-CHARTS (Control limits ) Since p represents a probability, negative values of LCL are senseless →If calculated LCL<0, then we just use LCL=0 → for that reason, control limits can be often asymmetric
p-CHARTS (variabe sample size) • In some applications, the sample is a 100% inspection of process output over some period of time. • Since different numbers of units could be produced in each period, the control chart would then have a variable sample size. • In these cases, we have m samples with different sizes (ni).
p-CHARTS (variable sample size) There are 3 possible strategies: Determine different control limitsfor each individual sample, depending on the sample size (ni): … as a result, each point of the control chart is associated to 2 individual control limits
p-CHARTS (variable sample size) Constant control limit calculated considering the average sample size. This approach can be reasonable if sample sizes do not differ greatly. Use of the Standardized Control Chart.
Control charts for nonconformities (DEFECTS) – ‘c’ and ‘u’ charts • A nonconforming item is a unit of product that does not satisfy one or more of the specification for that product. • Each specific point at which a specification is not satisfied results in a defect or nonconformity. • Consequently, a nonconforming item (defective) will contain at least one nonconformity (defect).
c - charts • It is possible to develop control charts for the number of nonconformities in an inspection unit (n = 1). • The inspection unit is simply an entity for which it is convenient to keep records. • Examples: bubbles in a sheet of glass, flaws in a bolt of fabric, stains in a ream of paper
u – charts: constant sample size • Same as c-chart, but here n > 1. • Example: circuit boards, c-chart or u-chart? u is plotted on the chart
u – charts: variable sample size • Same as with p-charts, we either use average n or we calculate individual limit for each sample
Other variable charts: individual chart • In many situations the sample size used for process monitoring consists of an individual unit (n=1). For example: • When the production rate is very slow and it is inconvenient to allow sample sizes of n>1 to accumulate before analysis (f.e. aircraft wings). • Destructive tests (f.e. to test the hermetic sealing of a plastic container, or to test a match just striking it).
Individual chart • In general, the larger the sample size (n), the more sensitive is the chart in detecting process shifts. • The drawback is that – for each point of the chart – more units are needed → more expenses to collect data • → charts for individual measurements are less sensitive than “conventional” control charts
Considering (sample average) shifts of the same size, in the second case a larger portion of the distribution is outside the control ( ). So the probability to detect a shift is higher
Individual chart • When the sample size consists of an individual unit (n=1), sample variability cannot be directly evaluated: • However, the moving range of two (or more) consecutive observations can be used to estimate the process variability • MRi = |xi – (xi -1)| • In this case, we can build an R-chart, considering samples made of n=2 successive units R = xmax– xmin
n = 2 … in this way we artificially create a variability to associate to each individual measurement
Individual chart (moving-range chart) • It is essential to check the normality assumption when using the control chart for individuals. • For the moving-range (MR) chart we have: D3 and D4 are functions of the moving range sample size (n=2 in this case)
Individual chart (moving-range chart) • The construction of individual measurements charts with moving range, is similar to the -R charts’ construction. • For the control chart for individual measurements (x), the parameters are: d2 is a function of the moving range sample size (n=2 in this case)
Individual chart (X-chart) • For individual measurements charts, we estimated