Download

1 / 22
230 likes | 518 Views
Extending ArcGIS with R. Mark Janikas, Ph. D. Outline . Introduction via demonstration Analyzing the future of the Wolverine in Washington State Description of R Why/When to use it? Integration options How to use it? Conclusions and Future Directions.

E N D
Extending ArcGIS with R Mark Janikas, Ph. D.
Outline • Introduction via demonstration • Analyzing the future of the Wolverine in Washington State • Description of R • Why/When to use it? • Integration options • How to use it? • Conclusions and Future Directions
Last Year: Point Clustering (Partitioning) • Cluster a given a set of point locations: • Spatial Proximity • Attributes Values (Including Time) • Cancer Clusters in New Mexico • Partitioning Earthquakes in California
The Problem • We want to examine what the potential effects of climate change will be on the distribution of animal species • We have the known current locations of the distributions of the species • We have a series of independent variables including • Vegetation type (as dummy variables) • Elevation, slope, and aspect • Distance from roads and cities • Etc.
The climate data From Ron Nielson’s group at Oregon State University/ US Forest Service Special Thanks to Kevin Johnston • We have two climate change models • Hadley (from the UK) • MIROC 3.2 (from Japan) • Each model has two scenarios • The moderate, mid-level “A1B” carbon scenario • The higher, more extreme “A2” carbon scenario • There are three time periods • “e”: Early-century, or 2020-2024 averaged • “m”: Mid-century, or 2050-2054 averaged • “l”: Late-century, or 2095-2099 averaged
The model • Sample points created from the raster data • Tools created to run R logistics regression • Fit model • Coefficients and diagnostics statistics • Use coefficients to create a raster surface
Creating the raster surface • Apply the logistics formula with coefficients • Select for probability of .5 or greater • Repeat for each model, for each scenario, and for time period 1 / (1 + exp( -1 * (9.595857 + (-1.28212 * tmp1991) + (-0.003687 * ppt1991) + (0.426121 * veg8_10) + (-0.560821 * veg7_10) + (-2.077026 * veg6_10) + (-2.941375 * veg2_10) + (-0.496024 * veg17_10) + (-1.740473 * veg16_10) + (0.557113 * veg12_10) + (-7.103907 * veg10_10) + (0.016223 * slope) + (-0.000674 * elevation) + (-0.000555 * aspect) + (-0.000062 * disthigh) + (0.000049 * distcity))))
Demo Title: Climate Change Sampling Logistics regression Creating a surface
What is R? Why should I use it? • R (The R Project for Statistical Computing) is an open-source data analysis package. (GNU S) • Widely Used • Over 60 CRAN sites across 30+ countries • Its Free • GNU GENERAL PUBLIC LICENSE • Base is powerful • Statistics, Linear Algebra, Visualization , etc… • Its extendible • 1800+ Contributed Extensions • splancs, spatstat, spdep, rgdal, maptools, shapefiles
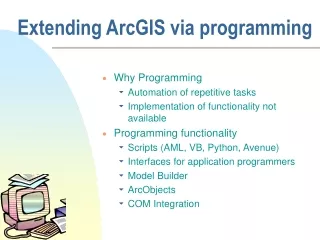
Integration with ArcGIS • Two Integration Options With ArcGIS • Both require Python • Both have pros and cons • ESRI UC Plenary 2008 • predicting plant species in unknown areas
Integration: R Option • Decouples R and Python • Python • Retrieves and organize parameters from ArcGIS • Convert Data (Interchange) • Shapefiles, netcdf, img etc…. • Spawns R given the *.r file with provided parameters • R • Does the analysis • Python • Post-Processing • Projecting Data, Applying Symbology
Integration: R Option (Cont…) R Script Python Script ArcGIS
Integration: RPy Option • R and Python closely coupled • RPy and RPy2 • Python Interface to the R Programming Language • Python • Retrieves and organize parameters from ArcGIS • RPy module is imported and R commands are executed within the Python script file
Integration: RPy Option (Cont…) Python Script ArcGIS R Processing
Which One Should I Use? • R Option vsRPy (RPy2) Options • http://resources.arcgis.com/gallery/file/geoprocessing • ArcGIS 9.3 vs. ArcGIS 10
Which One Should I Use? (Cont…) • R Option • Integration Easy to Implement • Attractive to R Programmers • “Out of Proc”: Spawning R on every execute • Use Copy Features • Shapefiles • selection sets • Projections and other environment variables • You must use an R library for handling shapefiles • maptools, shapefiles • Two files per script tool (*.py and *.r) • Debugging can be difficult
Which One Should I Use? (Cont…) • RPy / RPy2 Option • For more advanced users (Python and R knowledge) • “In Process” • Will be MUCH faster after the first call • Honors selection sets • A robust choice of database formats • Will honor environment settings (GP Functions) • Only a single file associated with your script tool • RPy (First Generation) • Existing Bug with GP Python Framework • RPy2 (“Second” Generation 2.0.x) • Interaction with NumPy arrays incomplete • RPy2 (2.1.x) • No Windows Binaries
Conclusions • R • contains “cutting edge” data analysis techniques from a wide body of academic and applied fields • extendible • Open-source • Can be integrated with ArcGIS using Python • R versus RPy (RPy2) • Pros and Cons
Future Directions • RPy2 • Web Portal: RTools • spdep, spatstat and splancs • SAR/CAR Regression, Point Pattern Analysis • ArcNews Article • MATLAB, SPSS, PySAL • Calling Python from R • Leveraging geoprocessing within the R environment • RSPython: http://www.omegahat.org/RSPython/
Links • R • http://www.r-project.org/index.html • Rpy and RPy2 • http://rpy.sourceforge.net/ • Python • http://www.python.org/ • NumPy • http://www.numpy.org/
Related Sessions • Spatial Pattern Analysis • Regression Analysis for Spatial Data with ArcGIS • Geostatistical Analyst • ArcGIS Spatial Analyst – Statistical Modeling • Agent-Based Modeling in ArcGIS • Python Essentials in ArcGIS