Download
1 / 51
510 likes | 663 Views
The Global Electrical Circuit: A Review. Earle Williams MIT International Conference on Atmospheric Electricity Beijing, China August 2007. Outline - Global Circuit. The two Global Circuits : How are they different? Carnegie Curve vs Thunder Area

E N D
The Global Electrical Circuit: A Review Earle Williams MIT International Conference on Atmospheric Electricity Beijing, China August 2007
Outline - Global Circuit The two Global Circuits : How are they different? Carnegie Curve vs Thunder Area Robustness of Carnegie Curve for individual days Effects of Bomb tests in the 50s and 60s Long-term variations Response of global circuit to global change
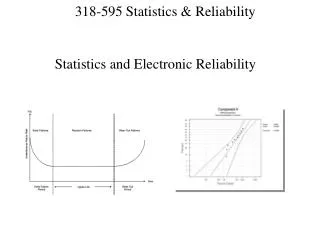
Classical Analysis of the Global Electrical Circuit Carnegie Curve Thunder Area
Wilson (1920) "Thunderclouds and shower clouds" are the sources for the global current.
A common Assertion: Thunderstorms are the batteries for the Global Circuit Wallace et Hobbs (1977) Williams ( 1988) Blakeslee et al (1989) Vonnegut (1991) Bering et al (1998) Rycroft at al (2000) Reddell et al (2004) Holzworth et al (2005) Hayakawa et al (2006) Kartalev et al (2005) Nickolaenko et al (2006) WILSON (1920) DID NOT MAKE THIS CLAIM
Distinctions in the two Global Circuits
The Global Balance Sheet(at Earth’s surface) Fine Weather Current + 60 C Precipitation + 30 C Lightning - 20 C Point Discharge - 100 C Wormell (1930,1953)
Global Lightning is more Volatile than the DC Global Circuit Diurnal Time Scale Carnegie Curve OTD Analysis Annual Time Scale Ionospheric Potential OTD Analysis
Two hypotheses for American Dominance over Africa in the Carnegie Curve Current control by position of magnetic dip equator (Kartalev et al, 2006). Electrified shower curves in South America dominate over Africa.
Measurements (Burns et al, 2005) and Predictions (Kartalev et al, 2006) for Seasonal Variations in the Carnegie Curve
African Lightning Exceeds South American Lightning Williams and Sátori (2004)
Carnegie Curve on Individual Days ? Ralph Markson : We should get the get the same result every day. Bob Holzworth : We can have factor-of-two fluctuations from one day to the next.
Diurnal Variations of Ionospheric Potential Note similarity with behavior of ‘carnegie curve’ (Markson et al, 1999)
Simultaneously Recorded Electric Field at Two Widely Separated Locations Holzworth et al (1984)
Electric Field at South Pole Observatory(Reddell et al, 2004)
Long-Term Variations in Electric Field at Two Sites in England 1955 1966 1955 1966
Ionospheric Potential and Stratospheric Burden of Radioactive Strontium
Downward Trends at Nagycenk (Hungary) and Eskdalemuir (UK) Märcz and Harrison (2003) Harrison (2003)
Evidence for Reduced Pollution in the UK in the 20th Century McIntosh (1957) Decline in smoke concentration at Eskdalemuir Novakov et al (2003) Decline in black soot production from 1920 onward Reduced Pollution Enhanced Conductivity Reduced Electric Field
Stability of Electric Field at Kennedy Space Center (Halstead Harrison, GRL 2006)
Air Earth current record at Kew From Harrison and Ingram, 2005 Air–earth current measurements at Kew, London, 1909–1979R.G. Harrison,T, W.J. Ingramb. Atmospheric Research 76 (2005) 49–64
Global circuit response to Global warming?
Anticipated Response of Global Circuit to Global Warming Anticipated sensitivity 10% per 1°C Measured global warming (tropics) 0.1°c per decade • Anticipated rate of increase 1% per decade This may go undetected in a short record
Temperature and Thunder Days, Fairbanks, AK 62 Summer Average Temperatures, Fairbanks, AK 1950 - 2005 60 58 Temperature (°F) 56 54 52 20 Summer Thunder Days, Fairbanks, AK 15 Number of Thunder Days 10 5 0 1950 1960 1970 1980 1990 2000 2010
The ‘DC’ and ‘AC’ Global Circuits are correlated, but do not track each other identically, for well established reasons. • Electrified shower clouds (Wilson, 1920) are fundamental in understanding differences between the ‘DC’ and ‘AC’ Global Circuits. • Nuclear weapons tests in the 1950-60’s appear to have had both local and global effects on the Global Circuit. • No substantive evidence exists for a long-term decline in the Global Circuit. • The absence of a clear upward trend in the Global Circuit is not inconsistent with the documented upward trend in temperature. CONCLUSIONS
Simpson’s (1905) Diurnal Variations in Lapland 0 2 4 6 8 10 12 14 16 18 20 22 UT


![SUBELEMENT T6 [4 Exam Questions - 4 Groups]](https://cdn0.slideserve.com/676932/subelement-t6-4-exam-questions-4-groups-dt.jpg)


![SUBELEMENT T6 [4 Exam Questions - 4 Groups]](https://cdn1.slideserve.com/1753527/subelement-t6-4-exam-questions-4-groups-dt.jpg)