Download
1 / 10
100 likes | 190 Views
Understand absolute value function transformations through reflection, shifts, stretches, compressions, translations, and vertex considerations.

E N D
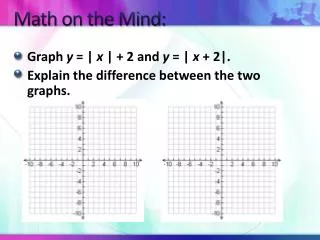
Math on the Mind: • Graph y = | x | + 2 and y = | x+ 2|. • Explain the difference between the two graphs.
Absolute Value Graphs Mrs. King Unit 9, Day 2
Graph This Absolute Value Function Reflect graph across the x-axis: f(x) flips the graphs
Graphing Absolute Value Functions Shifts 3 to the right Shifts 2 to the left Shifts 3 to the left Shifts 2 up Shifts 1 up Shifts 2 down Reflect over x-axis Reflect over x-axis
Transformations y = -a |x – h| + k *Remember that (h, k) is your vertex* Reflection across the x-axis Vertical Translation Vertical Stretcha > 1(makes it narrower)ORVertical Compression 0 < a < 1 (makes it wider) Horizontal Translation (opposite of h)
Example 1: • Identify the transformations: • y = 3 |x + 2| - 3 • y = |x – 1| + 2 • y = 2 |x + 3| - 1 • y = -1/3|x – 2| + 1
You Try: • Graph y = |x – 1| - 2 • Compare the graph with the graph of y = |x| (what are the transformations?)
Example 2: • Graph y = -2 |x + 3| + 2. • What transformations are involved? • What is your vertex?
Example 3: • Write a function for the graph shown.
You Try: • Write a function for the graph shown.


![Study Strategies in Various Disciplines (Math) at St. Cloud [MN] State University](https://cdn3.slideserve.com/6787961/slide1-dt.jpg)