Download
1 / 1
10 likes | 178 Views
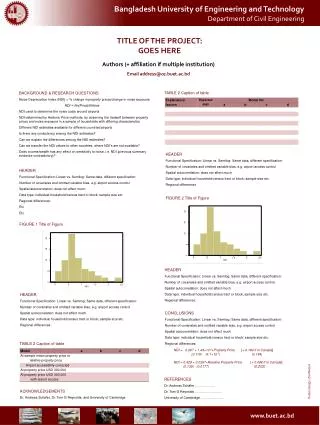
Department of Civil Engineering. TITLE OF THE PROJECT: GOES HERE. Authors (+ affiliation if multiple institution) Email address@ce.buet.ac.bd. TABLE 2 Caption of table. BACKGROUND & RESEARCH QUESTIONS Noise Depreciation Index (NDI) = % change in property prices/change in noise exposure

E N D
Department of Civil Engineering TITLE OF THE PROJECT: GOES HERE Authors (+ affiliation if multiple institution) Email address@ce.buet.ac.bd TABLE 2 Caption of table BACKGROUND & RESEARCH QUESTIONS Noise Depreciation Index (NDI) = % change in property prices/change in noise exposure NDI = ∂ln(Price)/∂Noise NDI used to determine the noise costs around airports NDI determined by Hedonic Price methods, by observing the tradeoff between property prices and noise exposure in a sample of households with differing characteristics Different NDI estimates available for different countries/airports Is there any consistency among the NDI estimates? Can we explain the differences among the NDI estimates? Can we transfer the NDI values to other countries, where NDI’s are not available? Does income/wealth has any effect on sensitivity to noise, i.e. NDI (previous summary evidence contradictory)? HEADER Functional Specification: Linear vs. Semilog: Same data, different specification: Number of covariates and omitted variable bias, e.g. airport access control Spatial autocorrelation: does not affect much Data type: individual household/census tract or block; sample size etc. Regional differences HEADER Functional Specification: Linear vs. Semilog: Same data, different specification: Number of covariates and omitted variable bias, e.g. airport access control Spatial autocorrelation: does not affect much Data type: individual household/census tract or block; sample size etc. Regional differences: Etc Etc FIGURE 2 Title of Figure FIGURE 1 Title of Figure HEADER Functional Specification: Linear vs. Semilog: Same data, different specification: Number of covariates and omitted variable bias, e.g. airport access control Spatial autocorrelation: does not affect much Data type: individual household/census tract or block; sample size etc. Regional differences: HEADER Functional Specification: Linear vs. Semilog: Same data, different specification: Number of covariates and omitted variable bias, e.g. airport access control Spatial autocorrelation: does not affect much Data type: individual household/census tract or block; sample size etc. Regional differences: CONCLUSIONS Functional Specification: Linear vs. Semilog: Same data, different specification: Number of covariates and omitted variable bias, e.g. airport access control Spatial autocorrelation: does not affect much Data type: individual household/census tract or block; sample size etc. Regional differences: NDI = 0.367 + 1.49×10⁻⁶×Property Price [+ 0.184 if in Canada] (0.119) (4.1×10⁻⁷) (0.184) NDI = 0.428 + 0.0367×Relative Property Price [+ 0.088 if in Canada] (0.139) (0.0177) (0.202) TABLE 2 Caption of table REFERENCES Dr. Andreas Schäfer ……………… Dr. Tom G Reynolds …………………… University of Cambridge ……………….. ACKNOWLEDGEMENTS Dr. Andreas Schäfer, Dr. Tom G Reynolds, and University of Cambridge