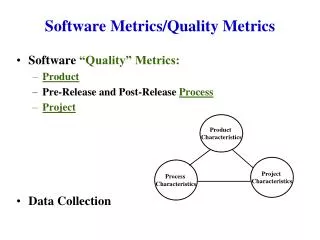
Software Metrics/Quality Metrics
Software Metrics/Quality Metrics. Software “Quality” Metrics: Product Pre-Release and Post-Release Process Project Data Collection. Product Characteristics. Project Characteristics. Process Characteristics. Software Metrics. Software Product All the deliverables

Software Metrics/Quality Metrics
E N D
Presentation Transcript
Software Metrics/Quality Metrics • Software “Quality” Metrics: • Product • Pre-Release and Post-Release Process • Project • Data Collection Product Characteristics Project Characteristics Process Characteristics
Software Metrics • Software Product • All the deliverables • Focus has been on Code, but interested in all artifacts • Product metrics include concerns of complexity, performance,size, “quality,” etc. • Pre-Release & Post Release Processes • Focus has been on Pre-Release processes • Easiest staring point for metrics – Testing and the number of “bug” found • Process metrics used to improve on development and support activities • Process metrics include defect removal effectiveness, problem fix response time, etc. • Project • Cost • Schedule • HR staffing and other Resources • Customer Satisfaction • Project metrics used to improve productivity, cost, etc. • Project metrics include cost such as effort/size, speed such as size/time, etc. • Project and Process metrics are often intertwined. Will talk about this more Function point
ProductQualityMetrics • What are all the deliverables ? • Code and Help Text • Documentation (function, install, usage, etc. in requirements & design specifications) • Education (set-up/configure, end-user, etc.) • Test Scenarios and Test Cases • Quality Question : (mostly intrinsic to the product but affects external customer satisfactions ) • When/where does it fail; how often • how many; defect rate
GQM (one more time from Basili) • A reminder on generating measurements: • In coming up with metrics think of GQM • What’s the goal • What’s the Question • What’s the metric • Goal: is Improved Quality • Question: What is the Post Release Defect Rate? • Metric: Number of problems found per user months
Some Definitions of Error to Failure • Error – human mistake that results in incorrect software (one or more fault or defect) • Defect or Fault – a mistake in the software product that may or may not be encountered • Problem – a non-functioning behavior of the software as a result of a defect/fault in the product. • Note that an error can cause one or more defects, and a defect can cause one or more problems. But a problem may never surface even if there is a defect which was caused by a human error.
When/Where Do Product Failures Occur • When/Where are somewhat intertwined • Right away – e.g. happens at install • Sometimes - e.g. happens at initialization-configuration • Sometimes – e.g. happens at certain file access • Generalized Metric • Mean time to failure (MTTF) • Difficult to assess • What should be the goal (8 hours, 30 days, 6 months), or should we just say --- “lessen the failure rate”? • Hard to test for and analyze (especially- prod. education, doc., etc.) • Applies better for simple logic (like stays up for z amount of time) Meantime to failure for install problem should probably be close to 0
Product Defects and Defect Rate • Most of the metric has been asked in terms of code but should be more inclusive: • Defect Volume: How many defects (for the complete product - not just for code) • Defect Rate= defects/(opportunity of defect) • Defects of all kind or by type (e.g. code, test cases, design, etc.) • Defects by severity (not quite a rate – more by category) • Opportunity of defect by(* also used to assess volume) : • Code : loc, function point, module • Documentation : pages, diagrams • Education or training: # of power point slides (doc) or amt. of time (delivery)
Code Defect Opportunity (LOC) • Using Lines of code (loc) “problems” • Executable, non-executable (comments) • Test cases and scaffolding code • Data and file declaration • Physical line or logical line • Language difference (C, C++, assembler, Visual Basic, etc.)
Possible Code Defect Rate Metrics • Often used : • Valid Unique Defect per line of executable and/or data code released(shipped) • IBM’s total valid unique defects / KSSI • Total valid unique defects / KCSI (only changed code) • Valid Unique Defect of “high severity” per line of executable and/or data code released (shipped) • What about all “in-line comments”; should they not count ? These provide opportunity of defects too. (especially for pre and post condition specifications) • What about Help text ?
Product Quality Metric (User View) • Defect rate is not as useful from user perspective: • What type of problems do users face?: • screen interface • data reliability/(validity) • functional completeness • end user education • product stability - crashes • error message and recovery • Inconsistencies in the handling of similar fucntionalities • How often are these types of defect encountered? ---- counted with -- MTTF -- means more to users? • Possible metric is : Problems per User Month(PUM) • user month is dependent on length of period and the number of users (this takes some tracking effort) • More Broader Customer Satisfaction issues • CUPRIMDSO – capability, usability, performance, rel. etc. (IBM), • FURPS – functionality, usability, reliability, etc. (HP)
Begin Function Point Separate Segment
Function Point (product size or complexity) metric • Often used to assess the software complexity and/or size • May be used as the “opportunity for defect” part of defect rate • Started by Albrecht of IBM in late 70’s • Gained momentum in the 90’s with IFPUG as software service industry looked for a metric • Function Point does provide some advantages over loc • language independence • don’t need the actual lines of code to do the counting • takes into account of many aspects of the software product • Some disadvantages include : • a little complex to come up with the final number • consistency (data reliability) sometimes varies by people
Function Point Metric via GQM • Goal: Measure the Size(volume) of Software • Question: What is the size of a software in terms of its: • Data files • Transactions • Metrics: • amount/difficulty of “Functionalities” to represent size/volume • consider Function Points ---- (defined in this lecture) What kind of validity problem might you encounter? – “construct”: applicability, “predictive”: relational ; “content” : coverage?
FP Utility • Where is FP used? • Comparing software in a “normalized fashion” independent of op. system, languages, etc. • Benchmarking and Prediction: • size .vs. cost • size vs development schedule • size vs defect rate • Outsourcing Negotiation
Methodology • Identify and Classifying: • Data (or files/tables) • Transactions • Evaluation of Complexity Level • Compute the Initial Functional Point • Re-assess the range of other factors that may influence the computed Functional Point and Compute the Function Point
1) Identifying & Classifying5 “Basic Entities” • Data/File: • Internally generated and stored (logical files and tables) • Data maintained externally and requires an external interface to access (external interfaces ) • Transactions: • Information or data entry into a system for transaction processing (inputs) • Information or data “leaving” the system such as reports or feeds to another application (outputs) • Information or data displayed on the screen in response to query (query) Note: - What about “tough” algorithms and other function oriented stuff? (We take of that separately in a separate 14 “Degree of Influences”)
2) Evaluating Complexity • Using a complexity table, each of the 5 basic entity is evaluated as : • low • average • high • Complexity table uses 3 attributes for decisions • # ofRecord Element Types (RET): e.g. employee data type, student record type ---- # offile types • # of unique attributes (fields) or Data Element Types (DET) for each record : e.g. name, address, employee number, and hiring date would make 4 DETs for the employee file • # ofFile Type Referenced (FTR): e.g an external payroll record file that needs to be accessed
5 Basic Entity Types uses the RET, DET, and FTRfor Complexity Evaluation For Logical Files and External Interfaces (DATA): # of RET1-19 DET20-50 DET50+ DET 1 Low Low Ave 2 -5 Low Avg High 6+ Avg High High For Input/Output/Query (TRANSACTIONS): # of FTR1-4 DET5 -15 DET16+ DET 0 - 1 Low Low Ave 2 Low Avg High 3+ Avg High High
Example • Consider a requirement: ability or functionality to add a new employee to the “system.” • (Data): Employee information involves, say, 3 external file that each has a different Record Element Types (RET) • Employee Basic Information file has employee data records • Each employee record has 55 fields (1 RET and 55 DET) - AVERAGE • Employee Benefits records file • Each benefit record has 10 fields (1 RET and 10 DET) - LOW • Employee Tax records file • Each tax record has 5 fields ( 1 RET and 5 DET) - LOW • (Transaction): Adding a new employee involves 1 input transaction which involves 3 file types referenced (FTR) and a total of 70 fields (DET). So for the 1 input transaction the complexity is HIGH
Function Point (FP) Computation • Composed of 5 “Basic Entities” • input items • output items • inquiry • master and logical files • external interfaces • And a “complexity level index” matrix : Low Average High 3 4 6 Input 5 7 Output 4 3 Inquiry 4 6 Logical files 7 10 15 Ext. Interface 7 5 10
3) Compute Initial Function Point • Initial Function Point : • Σ [Basic Entity x Complexity Level Index] all basic entities Continuing the Example of adding new employee: - 1 external interface (average) = 7 - 1 external interface (low) = 5 - 1 external interface (low) = 5 - 1 input (high) = 6 Initial Function Point = 1x7 + 1x5 + 1x5 + 1x6 = 23
4) More to Consider • There are 14 more “Degree of Influences” (DI) on a scale of 0 - 5 : • data communications • distributed data processing • performance criteria • heavy hardware utilization • high transaction rate • online data entry • end user efficiency • on-line update • complex computation • reusability • ease of installation • ease of operation • portability (supports multiple sites) • maintainability (easy to change)
Function Point Computation (cont.) • Define Technical Complexity Factor (TCF): • TCF = .65 + (.01 x DI ) • where DI = SUM ( influence factor value) • So note that .65 ≤ TCF ≤ 1.35 Function Point (FP) = Initial FP x TCF Finishing the Example: Suppose after considering 14 DI’s, our TCF = 1.15, then: Function Point = Initial FP x TCF = 23 x 1.15 = 26.45
Defect Rate: Defects/FP by CMM Levels • C. Jones estimated defect rates by SEI’s CMM levels through the maintenance life of a software product: • CMM Level 1 organizations – 0.75 defect/FP • CMM Level 2 - 0.44 • CMM Level 3 – 0.27 • CMM Level 4 – 0.14 • CMM Level 5 – 0.05 Be careful of this type of claims – use it with caution
End Function Point Separate Segment
Pre-Release Process Quality Metrics • Most common one is from testing (Defect Discovery Rate) defects found (by severity) per time period ( per dev. phase) • Compare “defect arrivals” by time by test phase • looking for “stabilization” (**what would the curve look like?*) • looking for a decreasing pattern • Compare number of defects by products • those with high number of problems found during pre-release tend to be “buggy” after release (interesting phenomenon) • Other Pre-Release quality metric: Defect Removal Effectiveness (e.g. Via inspection) • defects removed / ( total latent defects) • latent defects are estimated : how estimated? --- go back later with defects found in the field
Post-Release Product and Process • Post-Release Product: • # of Problems per Usage-Month (# of PUM) • Post-Release “Fix Process”: • Fix Quality = Number of Fix bugs/ Total number of fixes • Very sensitive if fix quality is not close to zero • Post-Release Process Quality • Problem backlog= total # of problems unresolved • by severity • by arrival date • Problem Backlog Index = # of problems resolved / # of arrivals per some time period such as week or month • Average Fix Response Time ( from problem open to close ) • These metrics are usually compared with a goal: • average response time on severity 1 problem is 24 hours • problem backlog index is between 1.3 and .8 (.8 may be problem!)
Collecting Data • Decide on what Metrics are to be used • measuring what (validity of measure) • what’s the goal (validity of measure) • Decide on how to collect the data • clearly defining the data to be collected • assure the recording is accurate (reliability) • assure the classification is accurate (reliability/validity) • Decide on tools to help in the collection • source code count • problem tracking
Data Collection Methodology (Basili & Weiss) • Establish the goal of the data collection • Develop a list of questions of interest • Establish data categories • Design and test data collection mechanism (e.g. forms) • Collect and check the reliability data • Analyze the data