Download
1 / 36
360 likes | 520 Views
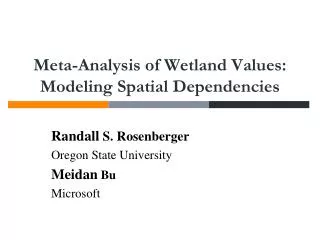
Meta-Analysis of Wetland Values: Modeling Spatial Dependencies. Randall S. Rosenberger Oregon State University Meidan Bu Microsoft. Overview. Spatial relationships in metadata Spatial econometric modeling Application to wetland valuation studies in North America

E N D
Meta-Analysis of Wetland Values: Modeling Spatial Dependencies Randall S. Rosenberger Oregon State University Meidan Bu Microsoft
Overview • Spatial relationships in metadata • Spatial econometric modeling • Application to wetland valuation studies in North America • Sensitivity analysis to intra-study dependence • Conclusions
Research questions • Are wetland values correlated across space? • What is the spatial relationship of wetland welfare estimates? • geographic closeness • ecological linkages • socio-economic characteristics of local people
Spatial Relationships • Proximity matters – location, location, location • Hedonic values increase with proximity to positive amenities • Hedonic values decrease with proximity to disamenities • Spatial heterogeneity matters (50km radius) Previous wetland values MRA results • Marginal values increase with local GDP • Marginal values increase with population density • Marginal values decrease with resource density
Statistical Problems Locational aspects lead to: • Spatial heterogeneity • Metadata augmentation – GDP, population & resource density • Omitted variable problem • Spatial dependence • Spatial lag – correlation in dependent variable • Omitted variable problem – biased, inconsistent estimates • Spatial error – correlation in errors • Uncorrelated error problem – inefficient estimates
Spatial Modeling • OLS model: • Generic spatial autoregressive model • Wi is the spatial weight matrix that defines the spatial relationship • W1 is the spatial lag (ρ is autoregressive parameter) • W2 is the spatial error (λ is autoregressive parameter)
The Empirical Model • A spatial lag autoregressive model – standardized wetland welfare estimates from primary studies (per hectare per year in 2010 USD) - the explanatory variables - the spatial lag (or spatial autoregressive) parameter – the weight matrix, which defines the spatial neighborhood relationship of wetland sites (I – ρW)-1 – the spatial multiplier
Spatial Weight Matrix Definition • Define an NxN spatial weight matrix C • Each element cijreflects spatial influence of location j on location i • Main diagonal = 0 (i.e., i≠j) • C is row standardized into W • where i≠ j
Spatial Weight Matrices • W defined as • Threshold (Euclidean) distances • Ecological similarity • Economic similarity
Threshold Distance W • Any two sites within a threshold are considered neighbors
Ecological similar neighbors • Any two sites located in the same boundary are considered neighbors • The USGS Hydrologic Unit 2 (HUC2) unit (n=21)
Economic similar neighbors • Any two sites sharing the same socioeconomic attributes (i.e., latent demand) are considered neighbors • local education level • population density within 50km radius • county level average personal income • local GDP • Multivariate hierarchical clustering analysis local education level • Group observations into clusters (n=40) that have similar values of measured variables
Wetland Metadata • Wetland welfare estimates from primary studies conducted in North America through 2011 • 80 studies, 163 value estimates • Explanatory variables • Study attributes • Valuation methodology • Wetland ecosystem type • Ecological functions valued • Geographic and socio-economic characteristics
Recap – Spatial MRAs • Positive spatial correlation for all three neighborhood criteria • Threshold distance neighbors are strongest correlation • Spatial correlation exists as far as 150km • Economic similarity defined neighbors has the weakest correlation • Covariate estimates are robust to spatial dependence, although magnitude varies some
Intra-study Correlation • What about confounding intra-study correlation? • An unbalanced panel meta-dataset with • 163 observations from 80 wetland sites • 39 wetland sites report multiple measures (max = 16 obs.)
Bootstrap Sensitivity Analysis • Bootstrap draw one observation per wetland site • Form 1000 sub-datasets • Repeat spatial MRAs • Test the significance of spatial correlation for every combination • Count the number of significant LLR results • Test the robustness of the spatial correlation
Recap – Sensitivity Analysis • Significant evidence of spatial correlation exists in threshold distance defined neighbors • Inconclusive evidence of spatial correlation in ecological and economic defined neighbors • Ecological similarity – HUC2 may be too large • Economic similarity – intra-study correlation
Conclusions • Spatial correlation exists, although partial effects are robust to specifications • Threshold distance is robust to intra-study correlation • Future issues: • Other spatial models (e.g., spatial error specification)? • What are the implications for international benefit transfers? • Are results consistent for other spatially dependent metadata?
Q&A We hope you enjoyed this tour of spatial econometric modeling in an MRA framework THANK YOU!
The Parking Lot – Best Fit Model • We also isolated the best fit (i.e. largest LLR) single observation model from among the 1000 bootstrapped samples • These results follow: • Inferences remain consistent across models • Magnitudes of effects are not robust to model specification • Likely due to small observations – n = 80