Download
1 / 34
340 likes | 518 Views
This study explores the utilization of ambient underwater sound for monitoring marine processes, identifying physical, biological, and anthropogenic sources. By classifying unique sound features—spectral and temporal— researchers can detect and quantify sources like wind, rainfall, marine mammals, and shipping noise. The research incorporates historical data and advances in acoustic technologies, such as the Acoustic Rain Gauge (ARG) and Passive Aquatic Listener (PAL), to enhance the understanding of marine environments. Key findings contribute to improved geophysical interpretations and biological monitoring, underscoring the significance of sound classification in oceanographic research.

E N D
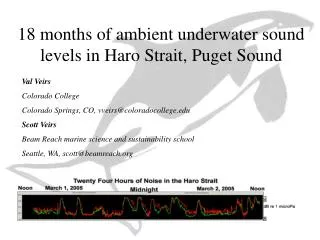
Monitoring Processes at Sea using Underwater Sound Jeffrey Nystuen Marie Curie International Fellow Hellenic Center for Marine Research and Principal Oceanographer Applied Physics Laboratory University of Washington Seattle, Washington, USA
Ambient sound is present from physical, biological and man-made sources. • Wind • Precipitation • Sea Ice • Marine mammals (whales/seals) • Ships and sonars • Use it as a signal to detect and quantify the sources.
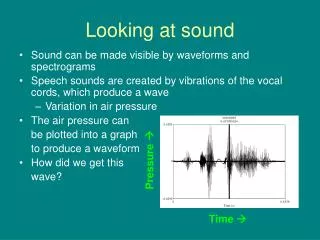
How do we interpret the ambient sound? Assume that different sound sources have unique features, spectral or temporal, that allow the source to be identified Classification is CRITICAL! Quantify (wind speed, rainfall rate, bubbles, whale identification, … Validate (anemometer, weather radar, sound clips, …)
Brief History 1940s – Knudsen – underwater noise 1962 –Wenzcurves – rain noise identified 1984 – acoustic wind measurements (Evans et al.) 1990 – acoustic wind speed algorithm (Vagle et al.) 1992 – lab studies of sound from raindrops (Medwin et al.) (acoustic physics of drop splashes) 1999-2002 – field measurements on TOGA-TAO array (PAL development) (Ma and Nystuen, 2005) 2001 – drop size distribution from sound (Nystuen) 2004 – Ionian Sea Rainfall Experiment (Nystuen et al. 2008) (spatial averaging) 2004 – ARGO float equipped with PAL (Riser et al. 2008) (Bay of Bengal monsoon signal) 2008 – POSEIDON weather observation system incorporates PALs 2010+ 45 ARGO floats with PALs to be deployed (Riser/Nystuen)
Instrumentation Acoustic Rain Gauge (ARG) = Passive Aquatic Listener (PAL) Designed to detect rainfall events Acoustic recorder: 1) high sample rate (100 kHz) 2) low duty cycle (1 %) 3) long deployment (low power) 4) adaptive sampling strategy Any recorder will work, but we really want: 1) rainfall rate 2) wind speed 3) whale detections … not sound levels
Two data collection modes 1) Time series of spectra - adaptive sampling strategy - variable time step depending on sound source 2) Selected original samples - used to identify sound source - 100 kHz sampling, 4.5 seconds
A single sample Drizzle
Classification depends on 1) spectral characteristic2) temporal patterns
Wind Sound generated by resonating bubbles at leading edge of breaking waves No signal for U < 3/ms Distribution of bubble sizes controls the shape of the spectrum At very high wind speed small bubbles are stirred down and absorb new surface generated sound Uniform spectral slope from 2-10 kHz at moderate wind speeds Sound levels highly correllated with wind speed
Rain Different distribution of bubbles sizes than for breaking waves 1 mm raindrops generate 15-22 kHz bubbles (drizzle) 2-3 mm raindrops generate larger bubbles (2-10 kHz) (heavier rainfall) 4-5 mm generate bubbles sound to 1-2 kHz (convective rain) Spectral slope flatter than wind from 2-10 kHz Sound generated by resonant bubbles created during the splashes of individual raindrops
Shipping Sound from engines, propellers, hull, etc. Generally more low frequency sound than wind or rain Close ships loud at all frequencies Distant ships (shipping) relative loud at lower frequencies Spectral slope from 2-8 is steeper than wind or rain
Verification of Classification Using sound clips to verify transient sounds
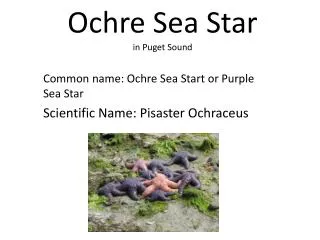
Marine mammal verification Aegean sea dolphin Pacific killer whale Bering Sea seal
Validation of Shipping Temporal record of ship passage Sound clips Close ship Naval sonar
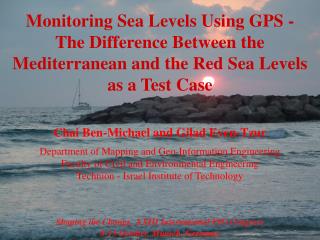
Validation of Rainfall Accumulation using POSEIDON data (rain gauges, weather radar, anemometers)
Acoustic products Sound Budgets What sound is loudest? When? At what frequency? Geophysical summaries Wind speed Precipitation Ice coverage Biological reports Cetacean detection Species diversity
Dominant Sound SourcesPercentage of time present 20 S 85 W 10 N 95 W Bering Sea Ionian Sea Carr Inlet Haro Strait Wind 93% 86% 90% 74% 80 % 21 % Rain - 8 % 3 % 3 % 8 % 5 % Ships 0.5 % 1.5 % 1 % 20 % 2 % 59 % Whale* 1.8 % 0.6 % - 0.5 % - - Other 5 % 4 % 6 % 2 % 10 % 15 % *30 kHz click detected – no visual confirmation
Geophysical Interpretation Wind - Athos POSEIDON mooring Rain - Athos POSEIDON mooring
Ringed seal walrus Bearded seal Killer whale Humpback whale Bowhead whale
Conclusions • Underwater sound can be used to monitor the marine environment • - Sound levels • Sound sources • Geophysical interpretation • Biological monitoring • Classification is critical
New Application: PALs on Argo Floats Argo Float – A6872 – STS/PAL Deployed October 2010 Summaries for Profiles 009 and 010
Period 009 (JD314-317, 2010) Rain : 9.7% Wind: 82.5 % Ship: 3.5 % Whales: 5.1% Rain accumulation: 17.4 mm
Period 010 (Days 317-321, 2010) % raining = 5.8 % drizzle = 2.2 % whales = 4.5 % wind = 87 Rain accumulation = 5.6 mm Drizzle accumulation = 1.4 mm