Download
1 / 9
90 likes | 236 Views
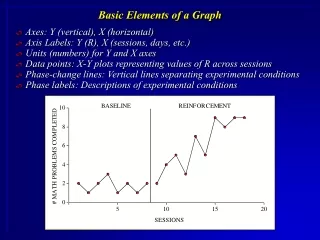
Basic Elements of a Graph. Axes: Y (vertical), X (horizontal) Axis Labels: Y (R), X (sessions, days, etc.) Units (numbers) for Y and X axes Data points: X-Y plots representing values of R across sessions Phase-change lines: Vertical lines separating experimental conditions

E N D
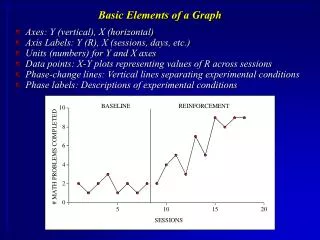
Basic Elements of a Graph • Axes: Y (vertical), X (horizontal) • Axis Labels: Y (R), X (sessions, days, etc.) • Units (numbers) for Y and X axes • Data points: X-Y plots representing values of R across sessions • Phase-change lines: Vertical lines separating experimental conditions • Phase labels: Descriptions of experimental conditions
Multiple Plot, Double-Y Axis(Used when data represent different units of measurement)
Frequency Plot versus Cumulative Record Frequency plot: Each data-point value is graphed separately Cumulative record: Each data-point value is added to the previous value
Characteristics of Data Evaluated via Graphical Analysis • Level: Mean (average) value of a set of data
Characteristics of Data Evaluated via Graphical Analysis • Trend: Systematic change in level across measurements
Characteristics of Data Evaluated via Graphical Analysis • Variability: Degree of fluctuation in a data set around its mean