Download
1 / 20
200 likes | 306 Views
A modeling experiment estimating Phobos spectrum based on laboratory data and assumptions. Utilizes a computer model of Phobos spectrum derived from mineral thermal emission spectra. Includes calculation details and formulas for background fluctuations, thermal time constants, and output signals. Discusses input and output data for ULIS detector, optical transmission, bolometer analysis, and noise calculations. Projects future improvements and calibration methods for more accurate results.

E N D
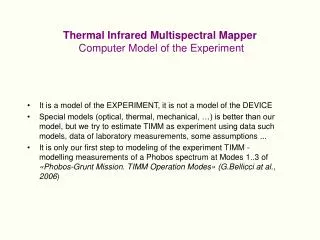
Thermal Infrared Multispectral Mapper Computer Model of the Experiment • It is a model of the EXPERIMENT, it is not a model of the DEVICE • Special models (optical, thermal, mechanical, …) is better than our model, but we try to estimate TIMM as experiment using data such models, data of laboratory measurements, some assumptions ... • It is only our first step to modeling of the experiment TIMM - modelling measurements of a Phobos spectrum at Modes 1..3 of «Phobos-Grunt Mission. TIMM Operation Modes» (G.Bellicci at al., 2006)
Phobos spectrumis combined from thermal emission spectra of minerals (we used data from fig3. [P.R.Christensen et al. (2004), Space Sci. Rev. 110,85]), its temperatures and shares, for example (gray matter with albedo 0.5 - 20%, carbonate - 30%, silicate - 50%): EmissivityFileName Temperature Share Emissivity100.txt 3 0.1 Emissivity100.txt 240 0.1 EmissivityCarbonate.txt 250 0.3 EmissivityOxide.txt 240 0 EmissivityPhosphate.txt 240 0 EmissivitySilicate.txt 240 0.5 EmissivitySulfate.txt 240 0
NETD=0.085 aperture=1 areaFillFactor=0.8 frequencyCadr=60 matrixHeight=120 matrixWidth=160 pixelPitch=3.5E-5 temperature=300 temperatureResponse=0.007 thermalTimeConst=0.007 waveLengthMax=1.6E-5 waveLengthMin=8E-6 NEP*=8.33579944151343E-12 NEPCadr*=6.45688248286132E-11 detectability*=375548283.096809 noiseCadr*=0.000595 noiseSec*=7.68141696997804E-5 omegaS*=7.69690200129499E-10 pixelArea*=9.8E-10 power*=8.4239373513421E-11 powerFull*=4.00664410705714E-10 powerResponse*=7063205.42501666 Input and output data for ULIS detector calculates
Optical transmission of the instrument (interferometer ~30%, filter and lens ~67%). Filter cutoff at 1500 cm-1.
Spectral flux on one bolometer (considering its spectral sensitivity) diameter=0.024 focalLength=0.02 aperture*=1.2 omega*=1.13097335529233 omegaS*=1.10835388818648E-9 flux*=-8.73773946040057E-9
Flux on one bolometeras function of Optical Path Difference in the assumption, that contrast of interferention picture is 50% OPDMax=0.00025 quality=0.5
NOISE’s • We assumed that detector output noise for each bolometers is independent processes with «flat» frequency specter of fluctuation and value of standard deviation calculated for ULIS detector: noiseCadr*=0.000595Volt. • We assumed that exist random drifts of temperatures TIMM elements (camera of the detector, lens, filter, interferometer, blend or elements KA) which lead to occurrence of background (BG) fluctuations Q(t) with frequency spectrum type of 1/f. • We used for calculates value of BG fluctuation next formula: Q(t2)=Q(t1)+RandomNormal(sQ*Sqrt(t2-t1)), where sQ is standard deviation for (t2-t1)=1sec. We used value of sQ equal to 2mK flux deviation for black body 273K and solid angle p. That value is equal to noise of the detector at averaging 4 cadres and 6*6=36 pixels.
Thermal time constant. OPD(t). 2D-array reading. • We considered influence of thermal time constant of bolometer on output signal v(t) by using formula: v(t2):=v(t1)+(u(t2)-v(t1))*(1-Exp(-(t2-t1)/thermalTimeConst)), where u(t2) is input signal. For (t2-t1)<1/60~16ms (period of frames) and thermal time constant 7ms it is a good approximation • We used simple formula: OPD(t)= -OPDMax+t*OPDSpeed for all bolometers of 2D-array. Of course we must some correct this formula in future. • We have assumed, that the 2D-array of bolometers is reading line by line and moment of reading element (i,j) on frame k may be calculated as t = (k-1)*durationFrame+(j-1)*durationLine+(i-1)*durationPixel
Output ADC signalwith detector noise and BG-fluctuations for parameters similar on Mode-3 (it is impossible set 131points at 10 sec with 60Hz frame rate) ADCOffset=256 ADCScale=2000 ADCMax*=186 ADCMin*=91 OPDSpeed=5E-5 OPDStep*=3.33333333333333E-6 pixX=7 pixY=7 binX=2 binY=2 binCadr=4 binPoint*=16 binInterferogram=1 durationInterferogram*=10 interferogramPoints*=150 durationPoint*=0.0666666666666667 fluctuationBgPoint*=7.48849856E-12 noiseBgPoint*=5.28928037180385E-5 noiseDetectorPoint*=0.00014875 temperatureFluctuationDay:=0.6 temperatureFluctuationDay=0.6 temperatureFluctuationSec*=0.002041
Calibrationusing 10+10 interferogrammes Cover and Sky.ERROR on Sky (Zero) spectrum is not critical for calculations, but shows us, that it is necessary to correct ADC_Shift or/and ADC_Scale
Estimate of result.Green curve is input specter. Red curve is output specter. Deviation on picture is standard deviation red curve from green curve.Deviation is not NESR @ 10 µm and 240 K: 1.15_10-7 W/(cm2 sr cm-1) as at «Phobos-Grunt Mission. TIMM Operation Modes» (G.Bellicci at al., 2006), but value 0.00103 W/(m2 sr cm-1) is close to it.
Future • Estimating not input and output specters, but input and output tables of minerals and its temperatures • Using in the model the experimental detector noise. It is possible that: (1) noises of bolometers on 2D-array is correlated, (2) noise is large at low frequency • Modeling images of Phobos. In case of large but uniform (on 2D-array) BG fluctuations (for example if Sun or Mars light on blend): (1) if Phobos image is small we get sky and Phobos signals at one time and may to remove BG fluctuations, (2) if Phobos image more then 2D-array size we can finding minerals or temperature anomalies on its surface with good signal-to-noise ratio. • Using data optical, thermal and mechanical TIMM models or/and data of testing TIMM devices • Removing errors in the program and making program more clear and understanding
Appendix. We can see ADC work if set for Cover signal binnig=1
Appendix. We can see BG fluctuations if set for Cover signal binning_of_pixels=6*6=36
Appendix. Parameters show and setting.In manyform’s it is possible to show values of program parameters, for example, «temperatureBolometer=273» by click on button and set program parameters writing «temperatureBolometer:=273» and click
Appendix.It is possible to show any array as graphic or/and as table . Graphic may be writing to file or copy to clipboard. Table may be editing, writing to file, reading from file ...