Download
1 / 16
160 likes | 174 Views
Learn about constant-time probabilistic inference in hierarchical sparse distributed representations for massive computing power increase via software and crucial advantages of SDR over localism.

E N D
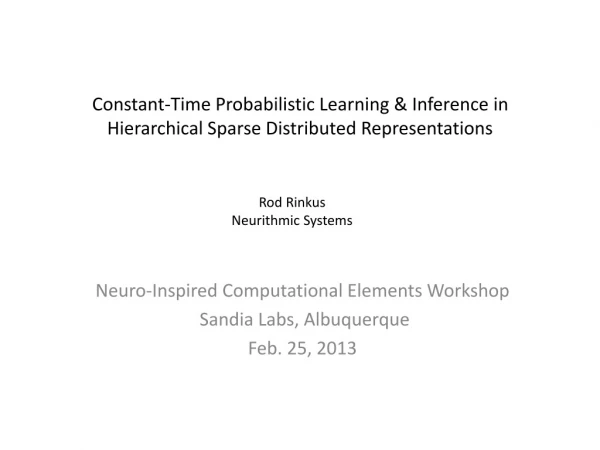
Constant-Time Probabilistic Learning & Inference in Hierarchical Sparse Distributed Representations Rod Rinkus Neurithmic Systems Neuro-Inspired Computational Elements Workshop Sandia Labs, Albuquerque Feb. 25, 2013
Massive Increase in Computational Power is Needed • Moore’s Law is running out: Hitting the physical limit of packing conventional computing elements on chips. • Problem size is growing at an exponential rate • e.g., inference over tera/peta-byte databases. • computational power must also scale exponentially. • Two possible sources for computational power increase: • Hardware • Software • New hardware technologies , e.g., memristors, graphenes, spintronics, 3D packing, etc., may bring several orders of mag. Improvement.
Massive Computing Power Increase via Software • The greatest gains in computing power will result from a software change. • By changing from localist to sparse distributed representations (SDR). • Currently, virtually all data is represented using localist representations. • Reasons for SDR’s increased power • SDR allows a population of Mrepresentational units to represent an >>Mitems (hypotheses). • SDR allows the likelihoods of ALL stored hypotheses to be computed with: • a single pass over the model’s components (weights, units). • Not, with a single pass over the stored hypotheses. • Thus, SDR admits a constant time algorithm for computing the MLH, i.e., finding the closest matching item in memory. • This in turn allows constant time storage (learning) of new items. • I’ll describe an algorithm that has both these properties. Neurithmic Systems 2013
Crucial Advantages of SDR over Localism Localist Representation SDR Item Code Code (version 1) Code (version 2) A C(A) C(A) C(A) B C(B) C(B) C(B) C C(C) C(C) C(C) D C(D) C(D) C(D) 1 M 1 M Q=4 WTA groups, K=3 units/group • Can only represent M items • Can represent ≫M items. The # of unique codes is MCQ (Version 1) & KQ (Version 2). 100 75 • CANNOT represent similarities by code intersections. • Activating a localist code of any single input leaves all other stored codes completely inactive, regardless of how similar or relevant their represented inputs may be. • CAN represent similarity directly by size of code intersections. 50 25 • Define the activation strength of a code as the fraction of its units that are active. 0 A B C D • If C(A) becomes active, C(B), C(C), and C(D) also simultaneously become partially active in proportion to their intersections with C(A), without any extra computational cycles. • Ifcode intersection size ∼ input similarity, then when hypothesis A is active, ALL stored hypotheses are simultaneously active in descending order of similarity (likelihood, relevance). Neurithmic Systems 2013
Terminology Clarification: Two senses of “Sparse Representation” in Literature Sparse Distributed Representation Sparse Basis • Every represented item, even at the lowest level: • is represented by a set of units. • Those sets can overlap. • The number of features needed to describe an input space is small compared to the number of all possible input patterns. • Olshausen & Field (O&F) sense, “sparse overcomplete basis” RU WTA Cluster SDR Coding Module • All papers that I’ve seen that describe learning of sparse bases use localist representations; one unit per feature. - From Lee, Grosse et al (2011)
Localist vs. SDR-based Hierarchical Representations C4 S4 C3 S3 C2 C1 S2 C1 S1 S1 This view distinguishes compositionality from distributedness. a) b) - Adapted from Serre et al (2005)
Application: Understanding Video Neurithmic Systems 2013
TEMECOR Algorithm: Constant Time Probabilistic Inference TEMECOR: Temporal Episodic Memory via Combinatorial Representations (1996) Steps 1 - 2.5 1. Individual neurons sum their bottom-up (u), horizontal (h), and top-down (d) inputs. 2. Normalize them to U, H, and D. 2.5. Multiply U, H and D, yielding a local degree of support (evidence), V, that the neuron should be activated. M2,1 L2 Top-Down (d) Inputs Horizontal (h) Inputs M1,1 L1 Bottom-Up (u) Inputs L0 Neurithmic Systems 2013
TEMECOR Algorithm – Steps 3-8 • Neuron with max V in each minc wins (1stround of competition, hard max) • Compute the average, G, of the max V’s over all Q mincs in a mac. • G is a measure of the familiarity of total input to the mac. • Modulate the units’ I/O functions so that: • as G goes to 1, the I/O function becomes an increasingly expansive nonlinearity • as G goes to 0, it becomes maximally compressive, i.e. the constant function. • Push the V ‘s through modulated I/O function, yielding a relative prob. Vector ()in each cluster. • Normalize to a full probability measure, . • Final winner in each minc chosen as draw from distribution (2ndround, soft max) Minicolumn ( “minc” ) 8 Average (G) 5 0 1 2 3 4 5 L1 0 1 2 3 3 3 0 1 2 0 1 2 0 1 2 0 1 2 0 1 2 3 3 3 Macrocolumn ( “mac” ) V 3 Max Max Max Max Max Max 4 Activation Function Modulator (AFM) L0 (Input) 0 1 2 4 5 6 7 8 9 10 11 3 Neurithmic Systems 2013
Algorithm Example: Storing First Spatial Input 0 0 0 0 0 0 0 0 0 0 0 0 1 1 1 1 1 1 1 1 1 1 1 1 2 2 2 2 2 2 2 2 2 2 2 2 3 3 3 3 3 3 3 3 3 3 3 3 8 Round 2: Separate draws in the Q= 6 mincs (i.e., softmax in each cluster) yields L1 code, 1 L1 .25 Set expansivity () of L1 activation function (i.e., of the V-to- transform) 7 5 0 1 6 0 1 2 0 3 Round 1: Find hard max V in each cluster (ties broken at random) 5 1 0 L1 Compute G: average of the max V ’s 4 0 1 2 3 4 5 6 7 8 9 10 11 L0 Neurithmic Systems 2013
Algorithm Example: Presenting Training Input Exactly 0 0 0 0 0 0 0 0 0 0 0 0 1 1 1 1 1 1 1 1 1 1 1 1 2 2 2 2 2 2 2 2 2 2 2 2 3 3 3 3 3 3 3 3 3 3 3 3 8 Round 2: Separate draws in the Q= 6 mincs (i.e., softmax in each cluster) yields L1 code, 1 L1 1.0 Set expansivity () of L1 activation function (i.e., of the V-to- transform) 7 5 0 1000 6 0 1 2 0 3 Round 1: Find hard max V in each cluster (ties broken at random) 5 1 0 L1 Compute G: average of the max V ’s 4 0 1 2 3 4 5 6 7 8 9 10 11 L0 Neurithmic Systems 2013
Algorithm Example Cont’d: 0 1 2 3 0 1 2 3 0 1 2 3 0 1 2 3 0 1 2 3 0 1 2 3 A L1 • Presenting exactly the same input again • 100% overlap L0 0 1 2 3 4 5 6 7 8 9 10 11 0 1 2 3 0 1 2 3 0 1 2 3 0 1 2 3 0 1 2 3 0 1 2 3 B • Presenting very similar input • 80% overlap G = 0.8 G = 0.4 G = 0 G = 1.0 L1 0 1 2 3 4 5 6 7 8 9 10 11 L0 0 1 2 3 0 1 2 3 0 1 2 3 0 1 2 3 0 1 2 3 0 1 2 3 C • Presenting very different input • 40% overlap L1 L0 0 1 2 3 4 5 6 7 8 9 10 11 0 1 2 3 0 1 2 3 0 1 2 3 0 1 2 3 0 1 2 3 0 1 2 3 D • Presenting entirely different input • 0% overlap L1 L0 0 1 2 3 4 5 6 7 8 9 10 11 Neurithmic Systems 2013
Simulation Results: Learning and Recognizing a 40-frame Sequence Q=9 mincs K=9 units / minc 40-frame 12x12 edge-filtered snippet from a natural video (some frames deleted) Q=9 mincs K=9 units / minc Q=16 mincs K=16 units / minc 12x12 Pixels 207,000 binary wts. Neurithmic Systems 2013
Simulation Results: Learning and Recognizing a 40-frame Sequence • The sequence is presented once. • A hierarchical spatiotemporal trace formed on the fly. • When sequence is presented a 2nd time, the exact same memory trace transpires throughout all levels and time steps. • In other words, the model finds the closest matching hypothesis at each moment. • The L1 mac has stored 40 codes. Each of these codes represents a particular spatiotemporal hypothesis, i.e., a particular “moment” • On each of the 40 frames, the combined U, H, and D signals to L1 conspire to reactivate the one correct code. • But the algorithm does not iterate over stored codes. • A few errors—single unit errors—are made during the recognition trial. However, they are corrected on the following time steps. • This means that when mapped to hardware, the system is fault tolerant. Neurithmic Systems 2013
Formation of a Hierarchical Spatiotemporal SDR Memory Trace • One mac per level • Different numbers of clusters per mac at each level • 4x5 pixel aperture Neurithmic Systems 2013
Conclusions • Massive increase in computing power needed • For general probabilistic inference. • TEMECOR’s probabilistic inference algorithm does constant time storage (learning) AND constant time best-match retrieval. • Of spatiotemporal patterns (sequences) • Primarily by using SDR instead of localist codes. • It can mapped to the new hardware technologies. • Corrects errors through time, fault-tolerant