Download

1 / 41
410 likes | 529 Views
Ch7 Inference concerning means II. Dr. Deshi Ye yedeshi@zju.edu.cn. Review. Point estimation: calculate the estimated standard error to accompany the point estimate of a population. Interval estimation

E N D
Ch7 Inference concerning means II Dr. Deshi Ye yedeshi@zju.edu.cn
Review • Point estimation: calculate the estimated standard error to accompany the point estimate of a population. • Interval estimation whatever the population, when the sample size is large, calculate the 100(1-a)% confidence interval for the mean When the population is normal, calculate the 100(1-a)% confidence interval for the mean Where is the obtained from t-distribution with n-1 degrees of freedom.
Review con. • Test of Hypothesis 5 steps totally. Formulate the assertion that the experiment seeks to confirm as the alternative hypothesis • P-value calculation the smallest fixed level at which the null hypothesis can be rejected.
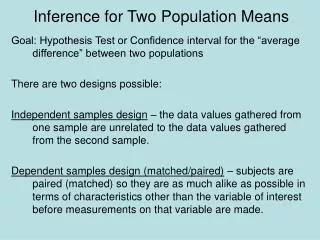
Outline • Inference concerning two means • Design Issues – Randomization and Pairing
7.8 Inference concerning two means • In many statistical problems, we are faced with decision about the relative size of the means of two or more populations. • Tests concerning the difference between two means • Consider two populations having the mean and and the variances of and and we want to test null hypothesis Random samples of size
Two Populations Paired Mean Proportion Variance Indep. Z Test t Test t Test Z Test F Test (Large (Small (Paired sample) sample) sample) Two Population Tests
Testing Two Means Independent Sampling& Paired Difference Experiments
Independent & Related Populations Independent Related
1. Different Data Sources Unrelated Independent Independent & Related Populations Independent Related
1. Different Data Sources Unrelated Independent 1. Same Data Source Paired or Matched Repeated Measures(Before/After) Independent & Related Populations Independent Related
1. Different Data Sources Unrelated Independent 2. Use Difference Between the 2 Sample Means X1 -X2 1. Same Data Source Paired or Matched Repeated Measures(Before/After) Independent & Related Populations Independent Related
1. Different Data Sources Unrelated Independent 2. Use Difference Between the 2 Sample Means X1 -X2 1. Same Data Source Paired or Matched Repeated Measures(Before/After) 2. Use Difference Between Each Pair of Observations Di= X1i - X2i Independent & Related Populations Independent Related
Two Independent Populations Examples • 1. An economist wishes to determine whether there is a difference in mean family income for households in 2 socioeconomic groups. • 2. An admissions officer of a small liberal arts college wants to compare the mean SAT scores of applicants educated in rural high schools & in urban high schools.
Two Related Populations Examples • 1. Nike wants to see if there is a difference in durability of 2 sole materials. One type is placed on one shoe, the other type on the other shoe of the same pair. • 2. An analyst for Educational Testing Service wants to compare the mean GMAT scores of students before & after taking a GMAT review course.
Thinking Challenge • 1. Miles per gallon ratings of cars before & after mounting radial tires • 2. The life expectancy of light bulbs made in 2 different factories • 3. Difference in hardness between 2 metals: one contains an alloy, one doesn’t • 4. Tread life of two different motorcycle tires: one on the front, the other on the back Are They Independent or Paired?
Test • The test will depend on the difference between the sample means and if both samples come from normal population with known variances, it can be based on the statistic
Theorem • If the distribution of two independent random variables have the mean and and the variance and , then the distribution of their sum (or difference) has the mean (or ) and the variance Two different sample of size
Statistic for test concerning different between two means Is a random variable having the standard normal distribution. Or large samples
EX. • To test the claim that the resistance of electric wire can be reduced by more than 0.05 ohm by alloying, 32 values obtained for standard wire yielded ohm and ohm , and 32 values obtained for alloyed wire yielded ohm and ohm Question: At the 0.05 level of significance, does this support the claim?
Solution • 1. Null hypothesis: Alternative hypothesis 2. Level of significance: 0.05 3. Criterion: Reject the null hypothesis if Z > 1.645 4. Calculation: 5. The null hypothesis must be rejected. 6. P-value: 1-0.996=0.04 < level of significance
Type II errors • To judge the strength of support for the null hypothesis when it is not rejected. • Check it from Table 8 at the end of the textbook The size of two examples are not equal
Small sample size • 2-sample t test.
EX • Mine 1 Mine 2 • 8260 7950 • 8130 7890 • 8350 7900 • 8070 8140 • 8340 7920 • 7840 The following random samples are measurements of the heat-producing capacity of specimens of coal from two mines Question: use the 0.01 level of significance to test where the difference between the means of these two samples is significant.
Solution • 1. Null hypothesis: Alternative hypothesis 2. Level of significance: 0.01 • Criterion: Reject the null hypothesis if t > 3.25 or t< -3.25 4. Calculation: 5. The null hypothesis must be rejected. 6. P-value: 0.004 < level of significance 0.01
Output • Two-sample T for Mine 1 vs Mine 2 • SE • N Mean StDev Mean • Mine 1 5 8230 125 56 • Mine 2 6 7940 104 43 • Difference = mu (Mine 1) - mu (Mine 2) • Estimate for difference: 290.000 • 99% CI for difference: (133.418, 446.582) • T-Test of difference = 0 (vs not =): T-Value = 4.19 P-Value = 0.02 DF = 9
SE mean: (standard error of mean) is calculated by dividing the standard deviation by the square root of n. • StDev: standard deviation .
Confidence interval • 100(1-a)% confidence interval for Where is based on degrees of freedom.
Matched pairs comparisons • Question: Are the samples independent in the application of the two sample t test? • For instance, the test cannot be used when we deal with “before and after” data, where the data are naturally paired. • EX: A manufacturer is concerned about the loss of weight of ceramic parts during a baking step. Let the pair of random variables denote the weight before and weight after baking for the i-th specimen.
Statistical analysis • Considering the difference • This collection of differences is treated as random sample of size n from a population having mean : indicates the means of the two responses are the same Null hypothesis:
EX • The following are the average weekly losses of worker-hours due to accidents in 10-industrial plants before and after a certain safety program was put into operation: • Before 45 73 46 124 33 57 83 34 26 17 • After 36 60 44 119 35 51 77 29 24 11 • Question: Use the 0.05 level of significance to test whether the safety program is effective.
Solution • 1. Null hypothesis: Alternative hypothesis 2. Level of significance: 0.05 3. Criterion: Reject the null hypothesis if t > 1.833 4. Calculation: 5. The null hypothesis must be rejected at level 0.05. 6. P-value: 1-0.9985=0.0015 < level of significance
Confidence interval • A 90% confidence interval for the mean of a paired difference. • Solution: since n=10 difference have the mean 5.2 and standard variance 4.08,
7.9 Design issues: Randomization and Pairing Randomization: of treatments prevents uncontrolled sources of variation from exerting a systematic influence on the response Pairing: according to some variable(s) thought to influence the response will remove the effect of that variable from analysis Randomizing the assignment of treatments within a pair helps prevent any other uncontrolled variables from influencing the responses in a systematic manner.