Download
1 / 16
160 likes | 308 Views
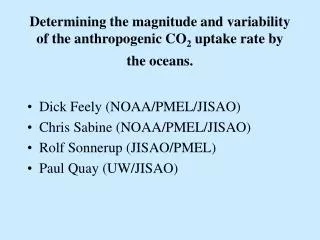
Determining the magnitude and variability of the anthropogenic CO 2 uptake rate by the oceans. Dick Feely (NOAA/PMEL/JISAO) Chris Sabine (NOAA/PMEL/JISAO) Rolf Sonnerup (JISAO/PMEL) Paul Quay (UW/JISAO). JISAO/PMEL/UW Collaboration. Observational Program (Feely, Sabine, Quay)

E N D
Determining the magnitude and variability of the anthropogenic CO2 uptake rate by the oceans. • Dick Feely (NOAA/PMEL/JISAO) • Chris Sabine (NOAA/PMEL/JISAO) • Rolf Sonnerup (JISAO/PMEL) • Paul Quay (UW/JISAO)
JISAO/PMEL/UW Collaboration • Observational Program (Feely, Sabine, Quay) • Measuring pCO2, dissolved inorganic carbon (DIC), alkalinity, 13C/12C of DIC (δ13C) • Using research cruises, volunteer observing ships (VOS), and moorings • Modeling Program (Sonnerup) • Using GCMs to simulate anthropogenic CO2, 13C/12C perturbations
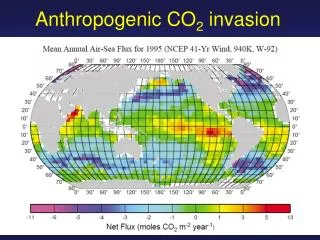
Estimates of Global CO2 Sources & Sinks ___________________________________________ ___________________________________________ ____________________________________________
Scientific Objectives • Estimate the rate of increase in the amount of anthropogenic CO2 in the ocean. (research cruises) • Estimate the net air-sea flux of CO2. (VOS+moorings) • Determine whether the US coastal ocean is a source or sink for CO2. (research cruises + moorings) • Separate natural variations from anthropogenic change in ocean CO2. (data synthesis + models) • Determine how changes in physical, chemical and biological processes affect the CO2 uptake rate. (models)
We mus understand the temporal and spatial changes of the global ocean carbon system and the feedbacks to the climate system. CLIVAR/CO2 Repeat Hydrography Program
Space and time coverage of ocean carbon observing networks time time centuries centuries Repeat Trans-basin Sections Repeat Trans-basin Sections decadal decadal Shipboard Time-Series Shipboard Time-Series Inter-annual Inter-annual Moored Time-Series Moored Time-Series VOS surface pCO2 VOS surface pCO2 Remote sensing Remote sensing seasonal seasonal daily daily Process Studies Process Studies hourly hourly space space Ocean Basin Ocean Basin 1 m2 1 m2 1 km2 1 km2 Regional (106 km2) Regional (106 km2) Globe Globe
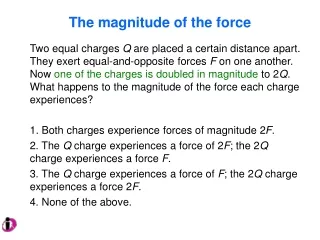
Rate of CO2 Increase • Atmospheric CO2 is currently at 375 ppm (vs pre-industrial 280 ppm) and has been increasing by about 2 ppm per year over the last decade. • Surface ocean in equilibrium with atmosphere would increase CO2 by 10 μmole/kg per decade. ~ 0.5% of background DIC concentration.
Rate of 13C/12C (δ13C) decrease • The δ13C of atmospheric CO2 today is –8.1 ‰ (versus –6.4 ‰ in pre-industrial era) and decreasing at 0.2 ‰ per decade. - δ13C of CO2 from fossil fuel combustion is -28 ‰. • Surface ocean δ13C in equilibrium with atmosphere would decrease at 0.2 ‰ per decade. • The magnitude of oceanic δ13C decrease is proportional to anthropogenic CO2 uptake.
Because the ocean mixes slowly, half of the anthropogenic CO2 stored in the ocean is found in the upper 10% of the ocean. 50% of anthropogenic CO2 in the ocean is shallower than 400 m Average penetration depth 1000 m
Seasonal and interannual changes in DIC and δ13C at Stn ALOHA (23°N 153°W)
Changes in DIC and δ13C between 1993 and 2003 in the N. Atlantic (Repeat of A16N)