Download
1 / 38
470 likes | 697 Views
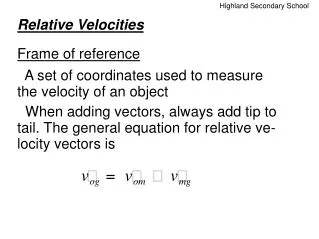
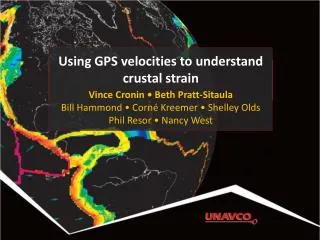
Using GPS velocities to understand crustal strain. Vince Cronin • Beth Pratt-Sitaula Bill Hammond • Corné Kreemer • Shelley Olds Phil Resor • Nancy West. UNAVCO & PBO. UNAVCO: non-profit consortium that provides geodetic research support

E N D
Using GPS velocities to understand crustal strain Vince Cronin • Beth Pratt-Sitaula Bill Hammond• Corné Kreemer • Shelley Olds Phil Resor• Nancy West
UNAVCO & PBO UNAVCO: non-profit consortium that provides geodetic research support Manages Plate Boundary Observatory (PBO): NSF EarthScope’s GPS network of 1100 stations (also campaign GPS,terrestrial LiDAR, InSAR…)
Module for Structural Geology Course • IN DEVELOPMENT but… • New approach with Infinitesimal rather than FiniteStrain • Combines Structural, Geophysics, & Tectonics • Our GOALS for this presentation: • Inform you module is coming • Share curriculum development model • Looking for feedback/suggestions • Looking for possible Beta-testers
Module GOAL Students use GPS data to gain a fundamental understanding of strainin the context of structural features and solving real geoscience problems (such as earthquake hazard)
Moving beyond Finite Strain http://marlimillerphoto.com/SrD-53.html Mushed trilobites still have a place, but we can do more
Module Audience & Overview Structural geology course (possibly geophysics or tectonics) 15-30 upper division students ~1 week time with in-class/lab and homework Quantitative skills development assuming low base (but extensions for higher level)
Module Development 3 Faculty Developers (content & instructional expertise) Assessment specialist Based on SERC’s InTeGrate module development process
UNAVCO Module Development Faculty Developers Vince C (Baylor) Phil R (Wesleyan) Geodesy Experts Bill H & Corne K. (UNReno) Education Specialists Beth P & Nancy W (UNAVCO) • Funded by UNAVCO (but with <<$ than InTeGrate) • Development workshop at UNReno in June 2012
Module GOAL Students use GPS data to gain a fundamental understanding of strainin the context of structural features and solving real geoscience problems (such as earthquake hazard)
Strain Translation Rotation Distortion Davis et al, Structural Geology, 2012
PBO GPS Stations, Tahoe Region P147 P139 P149
Strain between 3 GPS Stations http://www.baylor.edu/csr
North-South Locations East-West Locations Up-Down Locations
North-South Velocity East-West Velocity Up-Down Velocity 31
Strain between 3 GPS Stations http://www.baylor.edu/csr
Strain between 3 GPS Stations http://www.baylor.edu/csr
Strain between 3 GPS Stations http://www.baylor.edu/csr
Strain between 3 GPS Stations http://www.baylor.edu/csr
Strain between 3 GPS Stations 37 http://www.baylor.edu/csr
Strain between 3 GPS Stations Velocities Relative To P149 http://www.baylor.edu/csr
Strain between 3 GPS Stations Strain Relative To P149 http://www.baylor.edu/csr
Strain between 3 GPS Stations 40 http://www.baylor.edu/csr
Strain between 3 GPS Stations http://www.baylor.edu/csr http://marlimillerphoto.com/SrF-03.html
Strain between 3 GPS Stations http://www.baylor.edu/csr http://marlimillerphoto.com/SrF-27.html
Strain between 3 GPS Stations http://www.baylor.edu/csr http://marlimillerphoto.com/SrF-38.html
Preliminary Outcomes Students are able to: Describe meaning of GPS vectors Describe strain qualitativelybased on velocity vectors Back-envelope calculationsof strain rate (ex. across WA) mini lectures, groupactivities (physical models, small exercises), readings,homework
Primary Outcomes Students will be able to: • Access & download Plate Boundary Observatory (PBO) data for 3-station triangles • Do calculations to determine how triangle has rotated, translated, distorted • Analyze geological implications of strain and compare to: • Local structures • Regional earthquake hazard • Focal mechanisms (optional)
Activities • More readings & mini-lectures • Students are assigned triangle sets and through jig-saw puzzle teams observe range of different strains • Final Assessment • Students pick triangle set in area of personal interest; predict expected strain; calculate actual; compare and explain
Matrix algebra Translation (rate) Rotation (rate) Distortion (rate) Can be combined into matrix of form: d = G m And ultimately inverted to solve for unknowns “m” m = G-1d
Excel calculator Excel calculator is a “grey” box (some explanation) Extension with more student involvement in matrix algebra
For Discussion Questions Suggestions/requests Interested beta-testers (winter-spring 2013)?
Uncertainties The uncertainty of our strain estimate is a function of the individual uncertainties in the velocity estimates (available from UNAVCO) and how these uncertainties map into the model space. The data uncertainty can be expressed as a covariance matrix (covd) with diagonal values equal to the individual variances (s 2), assuming that the error in each station’s velocity estimate is independent of the other stations. For a linear equation of the form m=G-1d (our inverse solution). The covariance of the model (covm) can then be expressed as (Menke, 1989) or more simply as where the inverse of the data covariance matrix (covd)-1 is simply a diagonal matrix with values equal to 1/s 2 for each of the velocity estimates.
Earth Science Literacy Big Idea 1. Earth scientists use repeatable observations and testable ideas to understand and explain our planet. Big Idea 4. Earth is continuously changing. Big Idea 8. Natural hazards pose risks to humans.
Quantitative Skills Development Suggestions from SERC for Upper Division • Active engagement means students: • Work on problems that interest them • Design solution strategies • Articulate math ideas in words and argue methods with peers • Confront misconceptions • Ex. Make predictions and compare to actual • Multiple representations (numerical, graphical, verbal, etc) • Iteration (with timely feedback) • Appropriate use of technology
Assessment & Evaluation What does the student know? What is the student learning so far? What did the student learn? Are effective design practices being used? Are curricular goals being accomplished? • Formative assessments (for students) • Conversations • Homework • Quizzes • Summative assessments (for students) • Lab write up • Test/exam • Curriculum evaluation • Rubric/s • Faculty reflection
SERC’s InTeGrate Project Develop curricula that will teach geoscience in the context of societal issues across the disciplines. Create a population of college graduates poised to apply geoscience to viable solutions of current and future societal challenges InTeGrate module elements