Download
1 / 49
500 likes | 797 Views
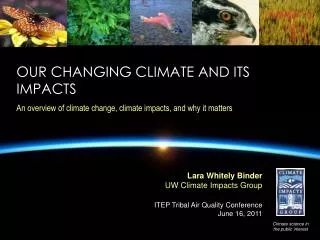
An overview of climate change, climate impacts, and why it matters. Our changing climate and its impacts. Lara Whitely Binder UW Climate Impacts Group ITEP Tribal Air Quality Conference June 16, 2011. Climate science in the public interest. Key Points to Today’s Talk.

E N D
An overview of climate change, climate impacts, and why it matters Our changing climate and its impacts Lara Whitely Binder UW Climate Impacts Group ITEP Tribal Air Quality Conference June 16, 2011 Climate science in the public interest
Key Points to Today’s Talk Human activities are altering and will continue to alter 21st century climate. How we experience climate change is a function of natural variability and climate change. Effects of a changing climate are already apparent, although also reflective of natural variability. Projected “high confidence” impacts include increasing temperatures, sea level rise, ocean acidification, declining snowpack, and shifts in streamflow patterns and timing. Information exists now for preparing for climate change impacts.
What is Driving Present Day Climate Change? The current concentrations of key greenhouse gases, and their rates of change, are unprecedented in the last 10,000 years. + 142% + 18% + 35% Carbon dioxide (CO2) Nitrous Oxide (N2O) Methane (CH4)
Longer-term CO2 Trends 2010 • Current concentrations are higher than any time in at least the past ~780,000 years • ~70% of CO2 emissions come from fossil fuel burning (chemical “fingerprint”) • 2010 avg annual CO2 concentration: 389 ppmv From a long term perspective, these changes are enormous
Average global temperature has increased 1.3°F since 1906.Warming since the 1950s very likely (>90% probability) due to the observed increase in GHG from human activities. Figure source: IPCC 2007
Recent U.S. Temperature Trends Average annual temperature in most areas of the U.S. have warmed 1 to 2°F since 1961. High-humidity heat waves (key char: high nighttime temps) have increased in the last 3 to 4 decades. Source: USGCRP 2009
3.6 °F CoolerWarmer 2.7 °F 1.8 °F 0.9 °F Mote 2003(a), updated 20th Century PNW Temperature Trends Temperature Trends (°F per century), since 1920 Average annual temperature increased +1.5F in the PNW during the 20th century • Much of the warming took place after 1950 • Most of the warming has occurred in winter and spring • An estimated 1/3 of warming attributable to ENSO and PDO
Evidence of change is increasingly visible throughout Earth’s natural systems Observed 20th century change • Arctic sea ice extent has declined (-34%, 1979-2009)(NASA 2009a) • Mean thickness has declined (- 23% , 1987-2007)(NASA 2009b) • Seasonal ice is now the dominant ice type (Kwok et al. 2009) • The Arctic sea ice melt season has lengthened (20 days longer on average, 1979-2007)(Markus et al. 2009)
Evidence of change is increasingly visible throughout Earth’s natural systems Observed 20th century change • The growing season in the U.S. and Canada has increased (+2 days/decade on average since 1950) (IPCC 2007, WG2) • Primary driver: earlier onset of spring (IPCC 2007, WG2; Linderholm et al 2006) • Changes in growing season length vary by region, altitude, and latitude (Linderholm et al 2006)
Evidence of change is increasingly visible throughout Earth’s natural systems Observed 20th century change • Northern hemisphere spring snow cover has declined (~8%, 1922-2005) (Lemke et al., 2007) • Western U.S. spring snowpack has declined (decreased in 73% (n=824)of stations, 1950-1997) (Mote et al. 2005)
DecreaseIncrease Mote et al. 2005
Over the past 1,000 yrs, late 20th-century (1980s to present) snowpack reductions are almost unprecedented in magnitude across the northern Rocky Mountains Pederson et al. 2011
Evidence of change is increasingly visible throughout Earth’s natural systems Observed 20th century change • Northern hemisphere spring snow cover has declined (~8%, 1922-2005) (Lemke et al., 2007) • Western U.S. spring snowpack has declined (decreases in 73% (n=824)of stations, 1950-1997) (Mote et al. 2005) • Spring snowmelt and peak runoff have shifted earlier (1 to 4 weeks in much of the western U.S., 1948-2002) (Stewart et al. 2005)
Evidence of change is increasingly visible throughout Earth’s natural systems Observed 20th century change • Northern hemisphere spring snow cover has declined (~8%, 1922-2005) (Lemke et al., 2007) • Spring snowpack has declined (decreases in 73% (n=824)of western U.S. stations, 1950-1997) (Mote et al. 2005) • Spring snowmelt and peak runoff have shifted earlier (1 to 4 weeks in much of the western U.S., 1948-2002) (Stewart et al. 2005) • Northern hemisphere glaciers are losing mass and/or length.
Mount Baker-Snoqualmie National Forest South Cascade Glacier Photos courtesy of Dr. Ed Josberger, USGS Glacier Group, Tacoma, WA
Evidence of change is increasingly visible throughout Earth’s natural systems Observed 20th century change • Ocean pH has decreased 30%(drop of ~0.1 since ~1750)(Feely et al. 2008) • Some of the strongest areas of acidification are in upwelling zones along the U.S. west coast(Feely et al. 2008)
Evidence of change is increasingly visible throughout Earth’s natural systems Observed 20th century change • Ranges for algal, plankton, and fish have shifted poleward in high-latitude oceans. • Plant and animal ranges are shifting northward and to higher elevations. • IPCC WG2 2007, Janetos et al. 2008
Changes in USDA Hardiness Zones http://www.arborday.org/media/mapchanges.cfm
Climate Modeling, Climate Projections, and Projected National and Regional Change Projected Changes in Climate
Projecting Future Climate: Greenhouse Gas Emissions Scenarios CO2 Emissions Scenarios CO2 Concentrations 40 emissions scenarios are used to “drive” global climate models. Different scenarios result in different climate change projections. A1FI A2 A1FI A2 A1B A1B B1 B1 Current emissions are in the current range of the A1B scenario. Figure source: IPCC 2001, Summary for Policy Makers
Without drastic changes in current emissions trends, GHG concentrations will increase dramatically over the 21st century and with that, global temperature. IPCC “best estimate” range of global-scale warming by the 2090s: 3.2°F-7.2°F (likely range: 2-11.5°F) Figure source: IPCC 2007 WG1, Summary for Policy Makers
B1 More warming is expected over land surface and in the Northern Hemisphere A1B A2 Projected surface temperature changes for the early and late 21st century, relative to 1980 to 1999 Figure source: IPCC 2007 WG1, Technical Summary, Fig TS.28
End of Century (2080-2099 Average) Projected Temperature Change (°F), relative to 1961-1979 baseline Lower Emissions Scenario (B1) Higher Emissions Scenario (A2) Range: +4 to +6.5°F Range: +7 to +11°F USGCRP 2009
A2 Scenario USGCRP 2009
Projected Increases in Annual PNW Temperature * Relative to 1970-1999 average Historic °C °F Mote and Salathé, 2009
Projected Change in North American Precipitation, 2080-2099 A2 Scenario USGCRP 2009 hatching = areas with highest confidence
Projected Increases in Annual PNW Precipitation * Relative to 1970-1999 average Historic Mote and Salathé, 2009
Increasing Extreme Precipitation Nationally, the 1-in-20 year extreme precip events is expected to be 10 to 25% heavier by the 2090s than present day (specific changes vary by location). USGCRP 2009
What About Changes in PNW Extreme Precipitation? Simulations generally indicate increases in extreme precipitation over the next 50 years, however: • The projections vary by model and region, and • Actual changes may be difficult to distinguish from natural variability. Salathé et al. 2009, Rosenberg et al. 2009)
Key Impact: Reduced Spring Snow Cover -29% -23% 1916-2006 Red shading indicates areas where April 1 snowpack is expected to decline. Chapter 5 - Macro-Scale Hydrologic Model Implementation, Elsner and Hamlet (2010), http://www.hydro.washington.edu/2860/. Map by Rob Norheim, CIG
Runoff patterns are temperature dependent, but the basic response is more runoff and streamflow in winter and early spring, with less in late spring and early summer A transient (snow/mix basin) Increasing winter flows Earlier, lower peak runoff Lower summer streamflow Elsner et al. 2009
Impacts to Seasonal Streamflow Timing cont. Rain and Snowmelt Dominant Basins Snowmelt Dominant Rain Dominant
Sea Level is Expected to Increase Major determinants of global sea level rise: • Melting of land-based ice sheets (Greenland, Antarctica) • Thermalexpansion of the ocean Sea level will not stabilize until several centuries after global temperatures stabilize. Global Projections for 2100: +7 to +23 inches (IPCC 2007) and more recently +2.6 ft to +6.6 ft (Pfeffer et al. 2008) Jakobshavn Fjord, Greenland
Washington State Sea Level Rise NW Olympic Peninsula: +2” (-9 to +35”) Central/Southern Coast:+11” (+2 to +43”) Medium (w/range) estimates of sea level rise in Washington for 2100: . Puget Sound: +13” (+6 to +50”) Mote et al. 2008
Ocean Acidification • Oceans have absorbed approximately 1/3 of the carbon emissions released by human activities since the preindustrial era. • As a result, ocean water is becoming more acidic. • Projected increase in ocean acidity by 2100: 150% (IPCC A2 scenario)
Effects of increasing carbon dioxide and temperature on coral reefs Credit: NOAA Coral Reef Targeted Research and Capacity Building for Management Program
What Can Influence Species Vulnerability? Functioning at the edge of geographic/elevation ranges e.g., alpine meadows Dependence on specialized habitat and/or microhabitat requirements e.g., Cascades frog (Rana cascadae) Impacts affecting specific life stages e.g., emergent tree seedlings Narrow environmental tolerances or thresholds e.g., temperature thresholds for salmon • Source: Snover et al, in review; IUCN 2008; Josh Lawler, UW
Factors Influencing Vulnerability cont’d • Presence of feedbacks and multiple stresses • e.g., drought stress and wildfire Dependence on specific environmental triggers e.g., lodgepole pine Dependence on interactions between species e.g., zooplankton, phytoplankton blooms; freshwater mussels (glochidia) Dr. Monica G. Turner, UW Madison Poor ability to disperse or colonize new ranges e.g., corals, Rockfish, Dungeness Crabs Clio pyramidata, R. Hopcroft, U of Alaska Fairbanks NOAA Population growth rates www.wildnatureimages.com • Source: Snover et al, in review; IUCN 2008; Josh Lawler, UW
Climate Change Impacts on Pika Distribution • Substantial reduction in area of distribution projected (decreases by 81-98%) • Increasingly fragmented distribution Trook and Hicke, in revision Slide courtesy of Jeff Hicke
Impacts to PNW Coastal Habitats NWF (2007) evaluation of impacts to coastal habitat at 11 locations in Washington and Oregon from 27.3” of sea level rise: • 65% loss of estuarine beaches • 61% loss of tidal swamps • 44% loss of tidal flats • 52% conversion of brackish marsh to tidal flats, transitional marsh, and saltmarsh Loss could affect availability of this habitat for spawning, juvenile rearing, migratory and over-wintering stopovers, commercial shellfish production National Wildlife Federation (2007), Sea-level Rise and Coastal Habitats in the Pacific Northwest An Analysis for Puget Sound, Southwestern Washington, and Northwestern Oregon
Floods Warm, low streamflow Salmon Impacted Across Full Life-Cycle Warmer lower flows in summer Acidification, warming, winds? Modified from Wilderness Society (1993)
Changes in Species DistributionProjected suitability changes: Lodgepole pine Data: Rehfeldt et al. 2006; Map by Rob Norheim, UW CIG Littell et al. 2009
Changes in Species DistributionProjected suitability changes: Douglas-fir (2060s) Data: Rehfeldt et al. 2006; map: Rob Norheim, UW CIG * Littell et al. 2009 *Modeled current distribution
Projected change (%) in area burned by ecoprovince for 1°C increase in average global temperature. Risk of Forest Fire Increases The amount of area burned throughout the West is projected to increase. • For the PNW as a whole, probability of a year >> 2 million acres increases: • Historical: 5% • 2020s: 5% (1 in 20) • 2040s: 17% (~1 in 6) • 2080s: 47% (~1 in 2) Figure source: Jeremy Littell, CIG. Map by Rob Norheim, UW CIG Littell et al. 2009
Human Health – Washington State • In Washington, climate change will lead to larger numbers of heat-related deaths due mainly to hotter summers. For example in greater Seattle, a medium climate change scenario projects 101 additional deaths for people over 45 by 2025 and another 50% increase by 2045 • Although better control of air pollution has led to improvements in air quality, warmer temperatures threaten some of the sizeable gains that have been made in recent years. Jackson et al. 2009
Information Sources • ITEP • University-based research programs (e.g., CIG, NOAA Regional Integrated Sciences and Assessment programs [RISAs]) • Federal agencies: • US EPA • USGS Climate Science Centers • Landscape Conservation Cooperatives • National Research Council’s “America’s Climate Choices” report series, specifically “Advancing the Science of Climate Change” • US Global Change Research Program – “Global Climate Change Impacts in the U.S.” report (2009) + 2nd Nat’l Assess. (2012?) • Intergovernmental Panel on Climate Change (2007 report)
For questions, please contact Lara Whitely Binder Climate Impacts Group University of Washington lwb123@uw.edu F