Download
1 / 25
250 likes | 467 Views
Learn how to apply break-even analysis to make informed business decisions. Calculate contributions, profits, and break-even points to optimize financial planning. Understand the Margin of Safety concept.

E N D
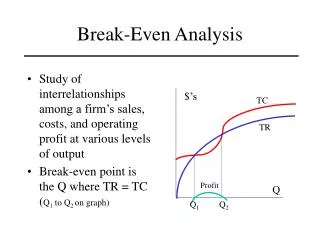
Break – even Analysis When total revenue equals total costs
PLANNING AND FINANCING A BUSINESS – Financial Planning Using Break-Even Analysis to Make Decisions Contribution per unit Contribution per unit of production is the amount that producing and selling that unit will contribute to Fixed Costs. Contribution per unit = selling price per unit – variable cost per unit Using the previous data: Contribution per unit = selling price per unit – variable cost per unit = £11.50 - £1.50 = £10.00 per unit
Calculations Work out the following contributions. Selling Price is £18 and Variable costs is £4. VC is £19 and SP is £21. SP is £250 and VC is £129. VC is £1560 and SP is £2108.
Total Contribution This is what production output makes to cover the fixed costs - it is not profit. Any surplus above the fixed cost amount is profit and any short-fall is a loss. If total contribution equals fixed costs then a break-even situation has arisen. Using the previous data: Total Contribution = contribution per unit x production output = £10.00 x 10,000 = £100,000 Total Profit = total contribution – total fixed costs = £100,000 - £85,000 = £15,000 (£15,000/10,000 = £1.50 profit per unit)
QUESTIONS Work out the total contribution on a business making a 2000 units of a product which is selling at £11.50 and the Variable cost is £1.50. If fixed costs are £5000 work out the total profit the business will make. Now work out the profit per unit that it will make. A different business is selling products for £10 the variable cost is £2. Work out the total contribution they are making when producing 4000 units. Their fixed costs are £30,000 work out the total profit the business will make. Now work out the profit per unit that it will make. A business is making 3500 units. The selling price is £9.80 and the variable cost £5 work out the total contribution. If fixed costs are £13800 work out the total profit the business will make. Finally work out the profit per unit.
Formulae: Contribution per unit = selling price per unit less variable cost per unit Total Contribution = contribution per unit multiplied by total units produced • If total contributionexceeds fixed cost the excess is profit • If total contribution equals fixed cost then break-even has occurred • If total contribution falls shortof fixed cost the shortfall is a loss
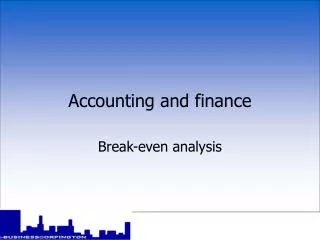
Break-even chart Costs and Revenues (£) 2,500 Total Revenue 2,000 Break even point Total Cost 1,500 1,000 Fixed Cost 500 0 100 200 300 400 500 Units of Output
MARGIN 0F SAFETY MARGIN OF SAFETY = CURRENT OUTPUT – BREAK – EVEN POINT = 500 – 300 = 200 UNITS This means the business can sell up to 200 fewer products before they start to lose money. This allows businesses to make important decisions e.g. To increase it by lowering costs or increasing revenue
BREAK – EVEN ANALYSIS/TARGETS Break – even is when TOTAL REVENUE EQUALS TOTAL COSTS. It is a good way for businesses to target how many units they need to produce to cover costs. SELLING PRICE – VARIABLE COST = CONTRIBUTION FIXED COST = BREAK – EVEN CONTIRBUTION e.g Nike are selling trainers for £45.oo. They cost £18.00 to make and the fixed costs for the store in Oxford Street is £250,000 a month. Therefore 45 – 25 = 20. This means for every trainer sold £27.00 is contribution. So 250,000 = 12,500 units a month. 20
Questions Work out the break – even targets for the following questions. SP £10 VC £4 and FC £1500. SP £15 VC £11 and FC £2000. The selling price is now £18 but VC remains at £11 and FC is £2000. Selling price reduces to £9 VC changes to £6 and FC is still £2000.
Using Break-even analysis to make Decisions 1. Complete the table below.
Using Break-even analysis to make Decisions 1.Complete the table below.
Using Break-even analysis to make Decisions 2. Draw a break-even chart using the information in your table. 3. Explain what you understand by the term ‘Margin of Safety’. Why might a business wish to calculate the Margin of Safety? 4. Assuming that maximum production capacity is 2,500 units and the break-even production level is 900 units, calculate the Margin of Safety at 90% capacity.
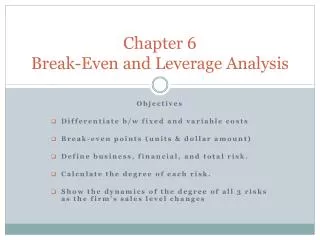
Using Break-even analysis to make Decisions – answer 2. Draw a break-even chart using the information in your table. Costs and Revenues £000 30 Total Revenue 25 Break-even Point Total Cost 20 15 10 Fixed Cost 5 Margin of Safety 0 700 800 900 1,000 1,100 1,200 Units of Output
Using Break-even analysis to make Decisions 3. Explain what you understand by the term ‘Margin of Safety’. Why might a business wish to calculate the Margin of Safety? The Margin of Safety is the quantity of goods that a business can afford not to sell/produce before they get into a loss-making situation. It can be calculated by the following formula: Margin of Safety = given production level less break-even output. A business may wish to calculate the Margin of Safety as it can help them plan for any disruption to production output. By calculating the Margin of Safety the business will know the level of non-production it can sustain before it starts to make losses.
Using Break-even analysis to make Decisions – answer 4. Assuming that maximum production capacity is 2,500 units and the Break Even production level is 900 units, calculate the Margin of Safety at 90% capacity. Production capacity at 100% = 2,500 units Production capacity at 90% = 2,500 x 0.9 = 2,250 units Margin of Safety = Production capacity at 90% less Break even output = 2,250 - 900 = 1,350 units.
Using Break-even analysis to make Decisions 5. Explain what you understand by the term ‘Contribution per Unit’. 6. Using the Contribution concept calculate: The profit made by producing and selling 1,500 units with the selling price being £25, the variable cost per unit £15 and fixed costs are £9,000.
Using Break-even analysis to make Decisions 5. Explain what you understand by the term ‘Contribution per Unit’. Contribution per unit is the amount each unit produced contributes towards the fixed costs. Contribution per unit is calculated by the following formula: Selling Price per unit -Variable Cost per unit.
Using Break-even analysis to make Decisions – answer 6.Using the Contribution concept calculate: The profit made by producing and selling 1,500 units. Units produced and Sold: 1,500 Contribution per unit = Selling Price per unit less Variable Cost per unit = £25 - £15 = £10 Total Contribution = Contribution per unit multiplied by Number of units produced = £10 x 1,500 = £15,000 Profit = Total Contribution minus Fixed Cost = £15,000 - £9,000 = £6,000
Using Break-even analysis to make Decisions 7. With reference to Question 1 re-calculate the break-even point if: The Fixed Cost increased to £10,000 and the Variable Cost per unit increased to £20, the Selling Price per unit remaining the same at £25. The Fixed Cost decreased to £5,000 and the Variable Cost per unit decreased to £9, the Selling Price per unit remaining the same.
Using Break-even analysis to make Decisions – answer 7. The Fixed Cost increased to £10,000 and the Variable Cost per unit increased to £20, the Selling Price per unit remaining the same. Fixed Cost = £10,000 Variable Cost per unit = £20 Selling Price per unit = £25 Contribution per unit = Selling price per unit - Variable Cost per unit = £25 - £20 = £5 per unit Break-even point in units = Fixed Cost ÷ Contribution per unit = £10,000 ÷ £5 =2,000 units
Using Break-even analysis to make Decisions – answer The Fixed Cost decreased to £5,000 and the Variable Cost per unit decreased to £9, the Selling Price per unit remaining the same. Fixed Cost = £5,000 Variable Cost per unit = £9 Selling Price per unit = £25 Contribution per unit = Selling price per unit - Variable Cost per unit = £25 - £9 = £16 per unit Break-even point in units = Fixed Cost ÷ Contribution per unit = £5,000 ÷ £16 = 312.5 units
Advantages of using break-even analysis It can be used to show relevant costs and revenues in diagrammatic form. It’s quick – managers can see the break – even point and margin of safety immediately so they can take quick action to cut costs or increase sales if they need to increase there margin of safety Businesses can use it to help persuade banks to give them a loan. It can influence decisions on whether new products are launched or not – if the business would need to sell an unrealistic volume of products to break – even, they may not launch the product. It is a relatively easy concept to understand and is recognised by most businesses as a simple decision making tool to put into operation. For example, ‘you’ need to produce and sell 500 units of your product before you start to make a profit! Can you do this?
Disadvantages of using break-even analysis It assumes that variable costs always rise steadily. This isn’t always the case – a business may buy in bulk and therefore get discounts so costs would not go up in proportion to output It is limited in scope insofar as it can only relate to a single product. As many businesses have a multiple product portfolio a break-even analysis would have to be carried out on each product as each product would have its own cost and revenue structure. Its effectiveness as a management decision making tool is limited by the accuracy and dependability of the primary or secondary data used in the analysis. Therefore if data is wrong then the results will be wrong Its analysis is based on the assumption that all goods produced are sold. This may be a false assumption in a dynamic business environment where consumers ‘shop around’ and competitors take advantage of this.