Studying Human Population
This overview explores human population demography, focusing on fundamental concepts such as population density, dispersion patterns, sex ratios, and age structure. We analyze different population types between developing and developed countries, emphasizing the implications of fertility rates and survivorship on population growth. By utilizing techniques like quadrat sampling and mark-recapture, we better estimate population sizes and trends. Through visual tools like population pyramids, we illustrate age distributions and demographic changes over time, essential for understanding population dynamics globally.


Studying Human Population
E N D
Presentation Transcript
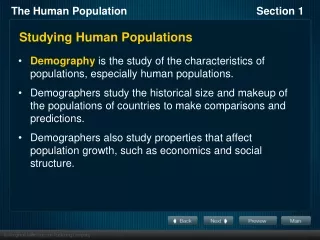
Demography • Def: Study of human populations
Properties of Populations • Density: The number of individuals per unit area or volume
Properties of Populations • Dispersion: Is the relative distribution or arrangement of individuals within a given amount of space
Dispersion Pattern • Clumped • Organisms are aggregated in patches • Most Common • Associated with uneven food distribution • Uniform • Organisms are evenly dispersed • Plants • Random • VERY VERY Rare in nature
Sex Ratio • Def: Proportion of Males to Females • A 50/50 Ratio maximizes population growth • An uneven ratio leads to negative population growth
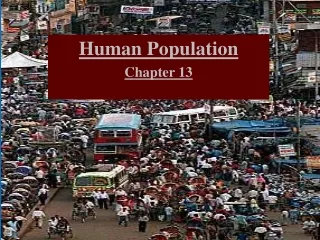
REMEMBER THIS??? • Developing Countries • Lower average incomes • Simple and agricultural based economies • Rapid population growth • Developed Countries • Higher average incomes • Slow population growth • Diverse, industrial economies
Age Structure • Def- the distribution of ages in a specific population at a certain time. • Is shown visually in Population Pyramids
5.Age structure– relative #’s of organisms of each age within a population Age (years) Mostly younger organisms positive growth Even age distribution stable population Mostly older organisms negative growth #2.2 Aim: How do we describe populations? Agenda QOD (5) Lesson: populations(15) Activity: (15) Summary (5) HW #9
Population Pyramids • A double-sided bar graph • Ex: Countries that have high rates of growth usually have more younger people than older people
Age Structure Cont. • Mostly Younger: Positive Growth • Even Age: Stable Population • Mostly Older: Negative Growth
Survivorship • Def: The percentage of members of a group that are likely to survive to any given age. • Used as a way to predict population trends.
Survivorship Curves • TYPE I: Most people live to be very old • TYPE II: Similar death rates at all ages • TYPE III: Many children die
Fertility Rates • Def: The number of babies born each year per 1,000 women in a population • Total fertility rate: The average number of children a women gives birth to in her lifetime.
Imagine a population with positive growth… 1. Describe the size, density, distribution, sex ratio, age structure, and birth/death rates of your population. 2. Work in pairs to make a mini-poster showing a picture and a diagram of either the age structure or the survivorship type. For example…
Example: Subway rats Size: about 1,000 organisms and increasing (positive growth) Density: medium (not high or low). Not a lot of competition for resources, not too hard to find mates. Distribution: clumped. The rats like to be near the stations where they find more food. Sex ratios: even. Since there are just about as many males as females, the population is increasing at a rapid rate. Age structure: mostly young. Since most of the rats in the population are in their reproductive prime years, the population is increasing at a rapid rate. Birth and death rates: The birth rate is higher than the death rate. The rats have Type 1 survivorship where they don’t usually die until old age. #2.2 Aim: How do we describe populations? Agenda QOD (5) Lesson: populations(15) Activity: (15) Summary (5) HW #9
Example: Subway rats Rats have Type 1 survivorship #2.2 Aim: How do we describe populations? Agenda QOD (5) Lesson: populations(15) Activity: (15) Summary (5) HW #9
Direct Counting • Method to estimate the size and density of population • Impractical due to size of ecosystem, the number of plants involved, and the movement of animals
Sampling Technique • A more practical way • Enables us to estimate the total population size of the organism • 1: Quadrat Sample Method • 2: Mark and Recapture Sampling
The Quadrat Sample • Used for estimating the size of plant population and immobile animals • A quadrat: A wooden frame which forms a square of a known area (1 m2). • Placed randomly in a population where sampling is carried out.
Quadrat Sampling • Used to find DENSITY: The mean number of organisms per unit area.
Quadrat Sampling • Used to find PERCENT COVERAGE: an indication of how much the area of quadrat is occupied by a species.
The Capture, Mark, Release, and Recapture Technique • Used to estimate mobile animals • Procedure: • First Capture: A random sample of animals is selected. • Mark: Each animal is marked in a distinctive way • Release: The marked animals are released back into nature • 2nd Capture: Only a proportion of the 2nd capture sample will have animals that were marked in the 1st capture.
Survey 2: Survey 1: M = 12 C = 15 R = 4
M = R N C N = M C R What is the total population size (N)? Note that the proportion marked in the population equals the proportion marked in the 2nd sample M = 12 C = 15 R = 4
N = 12 * 15 4 What is the total population size (N)? Note that the proportion marked in the population equals the proportion marked in the 2nd sample M = 12 C = 15 R = 4