
Uploaded by
addo
1 SLIDES
128 VIEWS
10LIKES
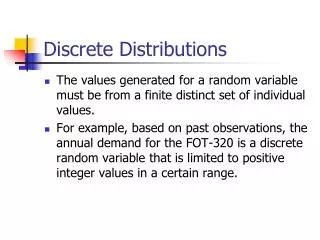
Comparing Probability Distributions in Discrete Mathematics
DESCRIPTION
Explore the functions and visual representations of geometric, binomial, and Poisson distributions with MATLAB code examples. Learn to analyze and compare the behavior of these discrete distributions. Great for students and professionals in statistics and mathematics.
Download
1 / 1
Download Presentation 
Comparing Probability Distributions in Discrete Mathematics
An Image/Link below is provided (as is) to download presentation
Download Policy: Content on the Website is provided to you AS IS for your information and personal use and may not be sold / licensed / shared on other websites without getting consent from its author.
Content is provided to you AS IS for your information and personal use only.
Download presentation by click this link.
While downloading, if for some reason you are not able to download a presentation, the publisher may have deleted the file from their server.
During download, if you can't get a presentation, the file might be deleted by the publisher.
E N D
Presentation Transcript
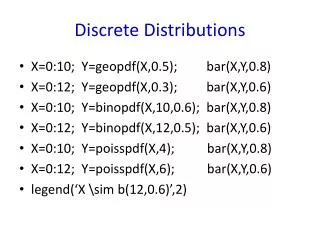
Discrete Distributions • X=0:10; Y=geopdf(X,0.5); bar(X,Y,0.8) • X=0:12; Y=geopdf(X,0.3); bar(X,Y,0.6) • X=0:10; Y=binopdf(X,10,0.6); bar(X,Y,0.8) • X=0:12; Y=binopdf(X,12,0.5); bar(X,Y,0.6) • X=0:10; Y=poisspdf(X,4); bar(X,Y,0.8) • X=0:12; Y=poisspdf(X,6); bar(X,Y,0.6) • legend(‘X \sim b(12,0.6)’,2)


More Related